Immigrants from Burma/Myanmar vs Immigrants from Grenada Divorced or Separated
COMPARE
Immigrants from Burma/Myanmar
Immigrants from Grenada
Divorced or Separated
Divorced or Separated Comparison
Immigrants from Burma/Myanmar
Immigrants from Grenada
12.1%
DIVORCED OR SEPARATED
30.4/ 100
METRIC RATING
196th/ 347
METRIC RANK
11.9%
DIVORCED OR SEPARATED
79.1/ 100
METRIC RATING
146th/ 347
METRIC RANK
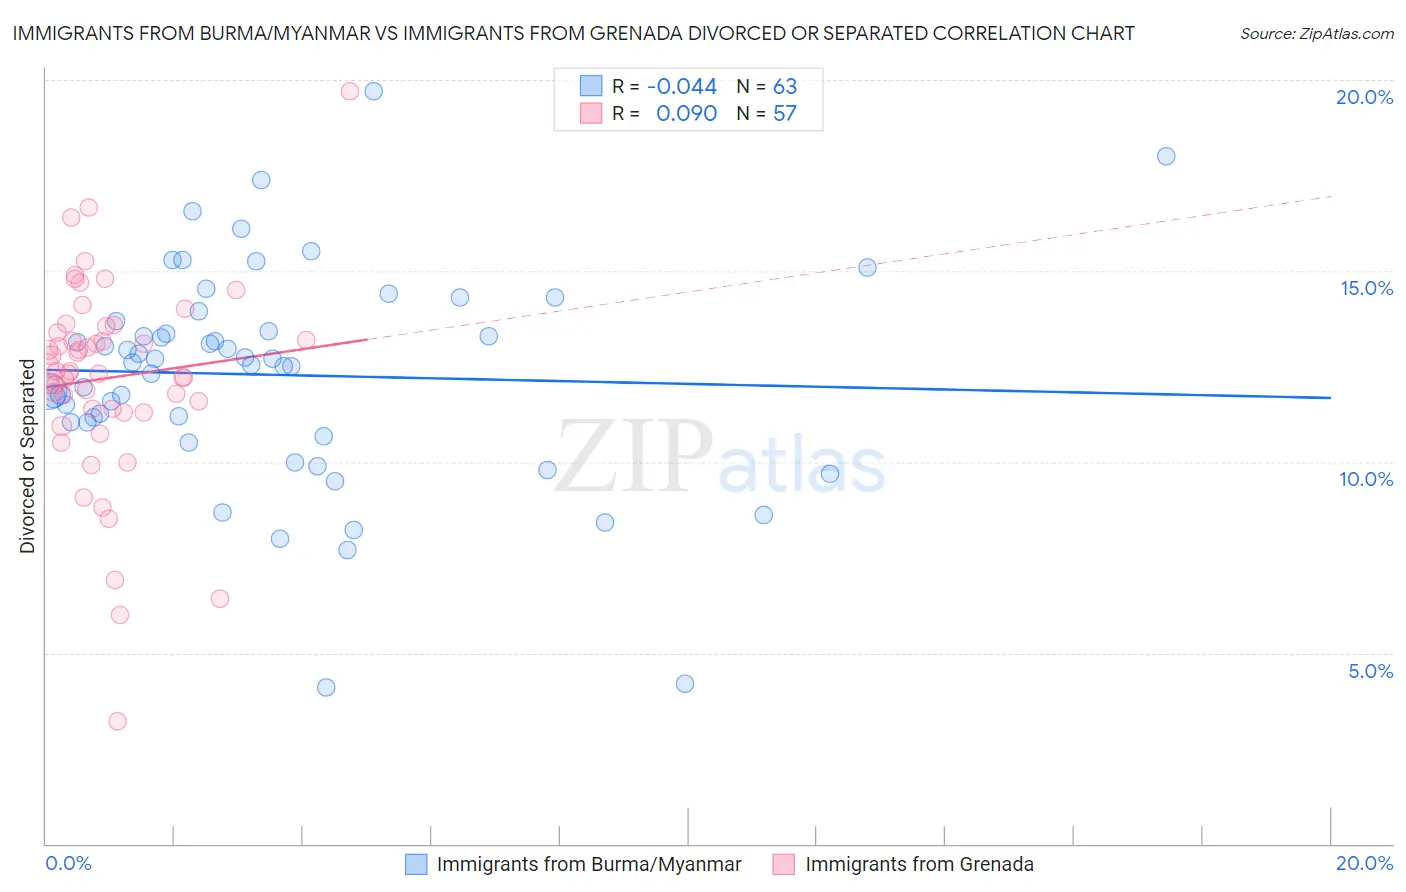
Immigrants from Burma/Myanmar vs Immigrants from Grenada Divorced or Separated Correlation Chart
The statistical analysis conducted on geographies consisting of 172,295,998 people shows no correlation between the proportion of Immigrants from Burma/Myanmar and percentage of population currently divorced or separated in the United States with a correlation coefficient (R) of -0.044 and weighted average of 12.1%. Similarly, the statistical analysis conducted on geographies consisting of 67,194,278 people shows a slight positive correlation between the proportion of Immigrants from Grenada and percentage of population currently divorced or separated in the United States with a correlation coefficient (R) of 0.090 and weighted average of 11.9%, a difference of 1.9%.
Divorced or Separated Correlation Summary
| Measurement | Immigrants from Burma/Myanmar | Immigrants from Grenada |
| Minimum | 4.1% | 3.2% |
| Maximum | 19.7% | 19.7% |
| Range | 15.6% | 16.5% |
| Mean | 12.3% | 12.2% |
| Median | 12.6% | 12.4% |
| Interquartile 25% (IQ1) | 11.0% | 11.3% |
| Interquartile 75% (IQ3) | 13.7% | 13.5% |
| Interquartile Range (IQR) | 2.7% | 2.1% |
| Standard Deviation (Sample) | 2.8% | 2.7% |
| Standard Deviation (Population) | 2.8% | 2.6% |
Similar Demographics by Divorced or Separated
Demographics Similar to Immigrants from Burma/Myanmar by Divorced or Separated
In terms of divorced or separated, the demographic groups most similar to Immigrants from Burma/Myanmar are Immigrants from Africa (12.1%, a difference of 0.0%), Nigerian (12.1%, a difference of 0.010%), Immigrants from England (12.1%, a difference of 0.040%), Central American (12.1%, a difference of 0.040%), and Immigrants from Eritrea (12.1%, a difference of 0.060%).
| Demographics | Rating | Rank | Divorced or Separated |
| Sierra Leoneans | 35.5 /100 | #189 | Fair 12.1% |
| Moroccans | 34.8 /100 | #190 | Fair 12.1% |
| Swedes | 34.4 /100 | #191 | Fair 12.1% |
| Norwegians | 33.2 /100 | #192 | Fair 12.1% |
| Immigrants | Thailand | 32.5 /100 | #193 | Fair 12.1% |
| Immigrants | Eritrea | 31.9 /100 | #194 | Fair 12.1% |
| Immigrants | England | 31.4 /100 | #195 | Fair 12.1% |
| Immigrants | Burma/Myanmar | 30.4 /100 | #196 | Fair 12.1% |
| Immigrants | Africa | 30.3 /100 | #197 | Fair 12.1% |
| Nigerians | 30.1 /100 | #198 | Fair 12.1% |
| Central Americans | 29.4 /100 | #199 | Fair 12.1% |
| South Americans | 28.6 /100 | #200 | Fair 12.2% |
| Guatemalans | 26.9 /100 | #201 | Fair 12.2% |
| Portuguese | 23.5 /100 | #202 | Fair 12.2% |
| Immigrants | Guatemala | 23.2 /100 | #203 | Fair 12.2% |
Demographics Similar to Immigrants from Grenada by Divorced or Separated
In terms of divorced or separated, the demographic groups most similar to Immigrants from Grenada are Polish (11.9%, a difference of 0.030%), Italian (11.9%, a difference of 0.070%), Immigrants from Oceania (11.9%, a difference of 0.070%), Croatian (11.9%, a difference of 0.080%), and Immigrants from Portugal (11.9%, a difference of 0.090%).
| Demographics | Rating | Rank | Divorced or Separated |
| Australians | 83.6 /100 | #139 | Excellent 11.9% |
| Lebanese | 83.4 /100 | #140 | Excellent 11.9% |
| Immigrants | Morocco | 82.9 /100 | #141 | Excellent 11.9% |
| Immigrants | Zimbabwe | 81.5 /100 | #142 | Excellent 11.9% |
| Pakistanis | 81.3 /100 | #143 | Excellent 11.9% |
| Peruvians | 80.9 /100 | #144 | Excellent 11.9% |
| Croatians | 80.6 /100 | #145 | Excellent 11.9% |
| Immigrants | Grenada | 79.1 /100 | #146 | Good 11.9% |
| Poles | 78.6 /100 | #147 | Good 11.9% |
| Italians | 77.8 /100 | #148 | Good 11.9% |
| Immigrants | Oceania | 77.7 /100 | #149 | Good 11.9% |
| Immigrants | Portugal | 77.3 /100 | #150 | Good 11.9% |
| Czechs | 76.4 /100 | #151 | Good 11.9% |
| Immigrants | Hungary | 73.7 /100 | #152 | Good 11.9% |
| Austrians | 72.2 /100 | #153 | Good 12.0% |