Native/Alaskan vs Immigrants from Grenada Family Households
COMPARE
Native/Alaskan
Immigrants from Grenada
Family Households
Family Households Comparison
Natives/Alaskans
Immigrants from Grenada
66.4%
FAMILY HOUSEHOLDS
100.0/ 100
METRIC RATING
51st/ 347
METRIC RANK
62.6%
FAMILY HOUSEHOLDS
0.0/ 100
METRIC RATING
290th/ 347
METRIC RANK
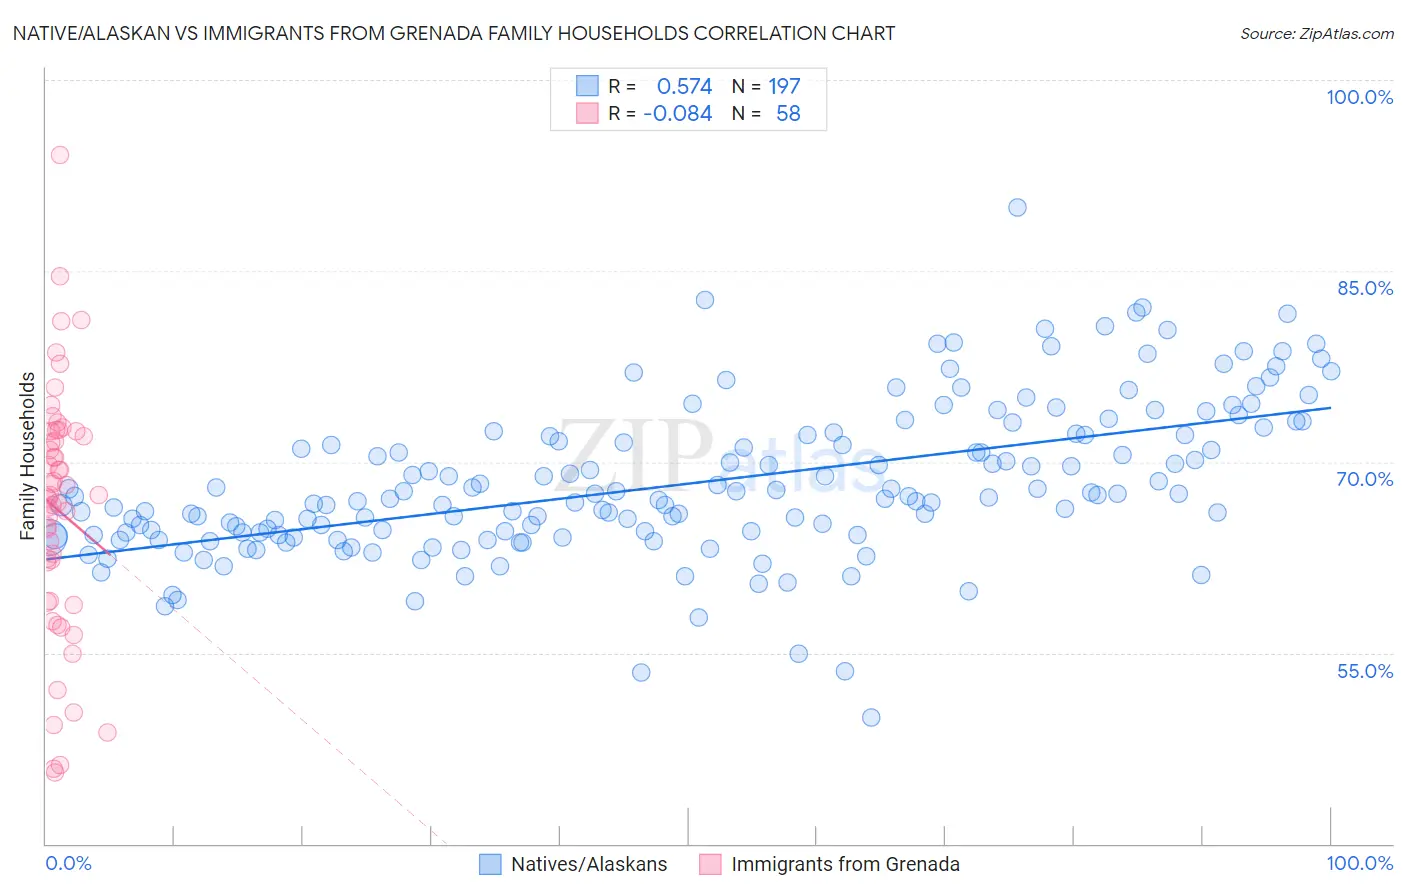
Native/Alaskan vs Immigrants from Grenada Family Households Correlation Chart
The statistical analysis conducted on geographies consisting of 512,654,863 people shows a substantial positive correlation between the proportion of Natives/Alaskans and percentage of family households in the United States with a correlation coefficient (R) of 0.574 and weighted average of 66.4%. Similarly, the statistical analysis conducted on geographies consisting of 67,190,411 people shows a slight negative correlation between the proportion of Immigrants from Grenada and percentage of family households in the United States with a correlation coefficient (R) of -0.084 and weighted average of 62.6%, a difference of 5.9%.
Family Households Correlation Summary
| Measurement | Native/Alaskan | Immigrants from Grenada |
| Minimum | 49.9% | 45.6% |
| Maximum | 90.0% | 94.1% |
| Range | 40.1% | 48.5% |
| Mean | 68.3% | 66.2% |
| Median | 67.2% | 67.3% |
| Interquartile 25% (IQ1) | 64.2% | 59.1% |
| Interquartile 75% (IQ3) | 72.1% | 72.4% |
| Interquartile Range (IQR) | 7.9% | 13.3% |
| Standard Deviation (Sample) | 6.0% | 9.8% |
| Standard Deviation (Population) | 6.0% | 9.7% |
Similar Demographics by Family Households
Demographics Similar to Natives/Alaskans by Family Households
In terms of family households, the demographic groups most similar to Natives/Alaskans are Navajo (66.4%, a difference of 0.030%), Immigrants from South Central Asia (66.4%, a difference of 0.090%), Immigrants from Venezuela (66.4%, a difference of 0.14%), Colombian (66.3%, a difference of 0.14%), and Afghan (66.3%, a difference of 0.14%).
| Demographics | Rating | Rank | Family Households |
| Asians | 100.0 /100 | #44 | Exceptional 66.5% |
| Venezuelans | 100.0 /100 | #45 | Exceptional 66.5% |
| Arapaho | 100.0 /100 | #46 | Exceptional 66.5% |
| Bolivians | 100.0 /100 | #47 | Exceptional 66.5% |
| Immigrants | Venezuela | 100.0 /100 | #48 | Exceptional 66.4% |
| Immigrants | South Central Asia | 100.0 /100 | #49 | Exceptional 66.4% |
| Navajo | 100.0 /100 | #50 | Exceptional 66.4% |
| Natives/Alaskans | 100.0 /100 | #51 | Exceptional 66.4% |
| Colombians | 100.0 /100 | #52 | Exceptional 66.3% |
| Afghans | 100.0 /100 | #53 | Exceptional 66.3% |
| Immigrants | Colombia | 100.0 /100 | #54 | Exceptional 66.3% |
| Immigrants | Immigrants | 100.0 /100 | #55 | Exceptional 66.1% |
| Immigrants | Hong Kong | 100.0 /100 | #56 | Exceptional 66.1% |
| Pennsylvania Germans | 100.0 /100 | #57 | Exceptional 66.1% |
| Immigrants | Asia | 100.0 /100 | #58 | Exceptional 66.1% |
Demographics Similar to Immigrants from Grenada by Family Households
In terms of family households, the demographic groups most similar to Immigrants from Grenada are U.S. Virgin Islander (62.6%, a difference of 0.050%), Immigrants from Nepal (62.7%, a difference of 0.080%), Immigrants from Burma/Myanmar (62.6%, a difference of 0.10%), Immigrants from Uganda (62.7%, a difference of 0.17%), and British West Indian (62.8%, a difference of 0.19%).
| Demographics | Rating | Rank | Family Households |
| Immigrants | Denmark | 0.1 /100 | #283 | Tragic 62.9% |
| Australians | 0.1 /100 | #284 | Tragic 62.8% |
| Mongolians | 0.1 /100 | #285 | Tragic 62.8% |
| British West Indians | 0.1 /100 | #286 | Tragic 62.8% |
| Latvians | 0.1 /100 | #287 | Tragic 62.8% |
| Immigrants | Uganda | 0.1 /100 | #288 | Tragic 62.7% |
| Immigrants | Nepal | 0.1 /100 | #289 | Tragic 62.7% |
| Immigrants | Grenada | 0.0 /100 | #290 | Tragic 62.6% |
| U.S. Virgin Islanders | 0.0 /100 | #291 | Tragic 62.6% |
| Immigrants | Burma/Myanmar | 0.0 /100 | #292 | Tragic 62.6% |
| Immigrants | Sweden | 0.0 /100 | #293 | Tragic 62.5% |
| Barbadians | 0.0 /100 | #294 | Tragic 62.5% |
| Okinawans | 0.0 /100 | #295 | Tragic 62.5% |
| Slovenes | 0.0 /100 | #296 | Tragic 62.4% |
| French American Indians | 0.0 /100 | #297 | Tragic 62.4% |