Moroccan vs Armenian Average Family Size
COMPARE
Moroccan
Armenian
Average Family Size
Average Family Size Comparison
Moroccans
Armenians
3.22
AVERAGE FAMILY SIZE
44.2/ 100
METRIC RATING
182nd/ 347
METRIC RANK
3.25
AVERAGE FAMILY SIZE
78.2/ 100
METRIC RATING
145th/ 347
METRIC RANK
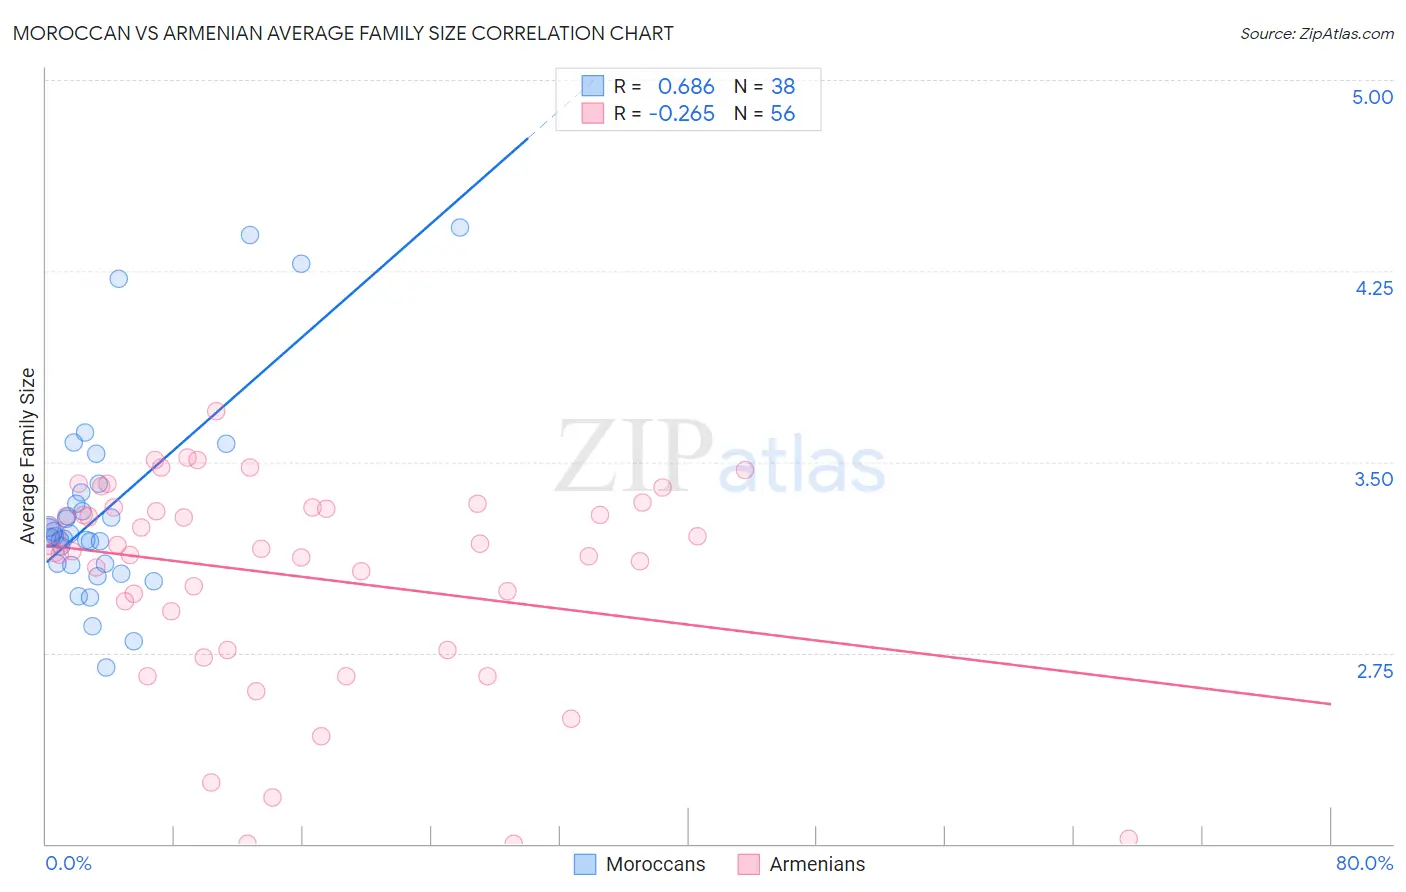
Moroccan vs Armenian Average Family Size Correlation Chart
The statistical analysis conducted on geographies consisting of 201,760,507 people shows a significant positive correlation between the proportion of Moroccans and average family size in the United States with a correlation coefficient (R) of 0.686 and weighted average of 3.22. Similarly, the statistical analysis conducted on geographies consisting of 310,784,313 people shows a weak negative correlation between the proportion of Armenians and average family size in the United States with a correlation coefficient (R) of -0.265 and weighted average of 3.25, a difference of 0.69%.
Average Family Size Correlation Summary
| Measurement | Moroccan | Armenian |
| Minimum | 2.69 | 2.00 |
| Maximum | 4.42 | 3.70 |
| Range | 1.73 | 1.70 |
| Mean | 3.32 | 3.05 |
| Median | 3.21 | 3.16 |
| Interquartile 25% (IQ1) | 3.10 | 2.84 |
| Interquartile 75% (IQ3) | 3.38 | 3.32 |
| Interquartile Range (IQR) | 0.28 | 0.48 |
| Standard Deviation (Sample) | 0.40 | 0.41 |
| Standard Deviation (Population) | 0.40 | 0.41 |
Similar Demographics by Average Family Size
Demographics Similar to Moroccans by Average Family Size
In terms of average family size, the demographic groups most similar to Moroccans are Spanish (3.23, a difference of 0.010%), Palestinian (3.23, a difference of 0.040%), Spaniard (3.23, a difference of 0.050%), Immigrants from Korea (3.23, a difference of 0.050%), and Immigrants from Northern Africa (3.22, a difference of 0.050%).
| Demographics | Rating | Rank | Average Family Size |
| Immigrants | China | 49.9 /100 | #175 | Average 3.23 |
| Israelis | 48.7 /100 | #176 | Average 3.23 |
| Argentineans | 47.4 /100 | #177 | Average 3.23 |
| Spaniards | 47.2 /100 | #178 | Average 3.23 |
| Immigrants | Korea | 46.9 /100 | #179 | Average 3.23 |
| Palestinians | 46.6 /100 | #180 | Average 3.23 |
| Spanish | 44.8 /100 | #181 | Average 3.23 |
| Moroccans | 44.2 /100 | #182 | Average 3.22 |
| Immigrants | Northern Africa | 41.7 /100 | #183 | Average 3.22 |
| Immigrants | Eastern Asia | 40.8 /100 | #184 | Average 3.22 |
| Immigrants | Sri Lanka | 39.8 /100 | #185 | Fair 3.22 |
| Immigrants | Argentina | 39.8 /100 | #186 | Fair 3.22 |
| Immigrants | Malaysia | 39.0 /100 | #187 | Fair 3.22 |
| Thais | 38.3 /100 | #188 | Fair 3.22 |
| Pakistanis | 33.7 /100 | #189 | Fair 3.22 |
Demographics Similar to Armenians by Average Family Size
In terms of average family size, the demographic groups most similar to Armenians are Immigrants from Africa (3.25, a difference of 0.010%), Tsimshian (3.25, a difference of 0.050%), Immigrants from Jordan (3.24, a difference of 0.060%), Bhutanese (3.25, a difference of 0.080%), and Blackfeet (3.24, a difference of 0.080%).
| Demographics | Rating | Rank | Average Family Size |
| Cubans | 81.8 /100 | #138 | Excellent 3.25 |
| Immigrants | Ethiopia | 81.6 /100 | #139 | Excellent 3.25 |
| Sub-Saharan Africans | 81.6 /100 | #140 | Excellent 3.25 |
| Venezuelans | 81.4 /100 | #141 | Excellent 3.25 |
| Liberians | 81.2 /100 | #142 | Excellent 3.25 |
| Bhutanese | 81.0 /100 | #143 | Excellent 3.25 |
| Tsimshian | 80.2 /100 | #144 | Excellent 3.25 |
| Armenians | 78.2 /100 | #145 | Good 3.25 |
| Immigrants | Africa | 77.9 /100 | #146 | Good 3.25 |
| Immigrants | Jordan | 75.7 /100 | #147 | Good 3.24 |
| Blackfeet | 75.0 /100 | #148 | Good 3.24 |
| Assyrians/Chaldeans/Syriacs | 73.8 /100 | #149 | Good 3.24 |
| Indians (Asian) | 73.6 /100 | #150 | Good 3.24 |
| Jordanians | 73.5 /100 | #151 | Good 3.24 |
| Spanish Americans | 72.5 /100 | #152 | Good 3.24 |