Moroccan vs Slovak Median Earnings
COMPARE
Moroccan
Slovak
Median Earnings
Median Earnings Comparison
Moroccans
Slovaks
$48,838
MEDIAN EARNINGS
96.7/ 100
METRIC RATING
114th/ 347
METRIC RANK
$47,095
MEDIAN EARNINGS
71.7/ 100
METRIC RATING
158th/ 347
METRIC RANK
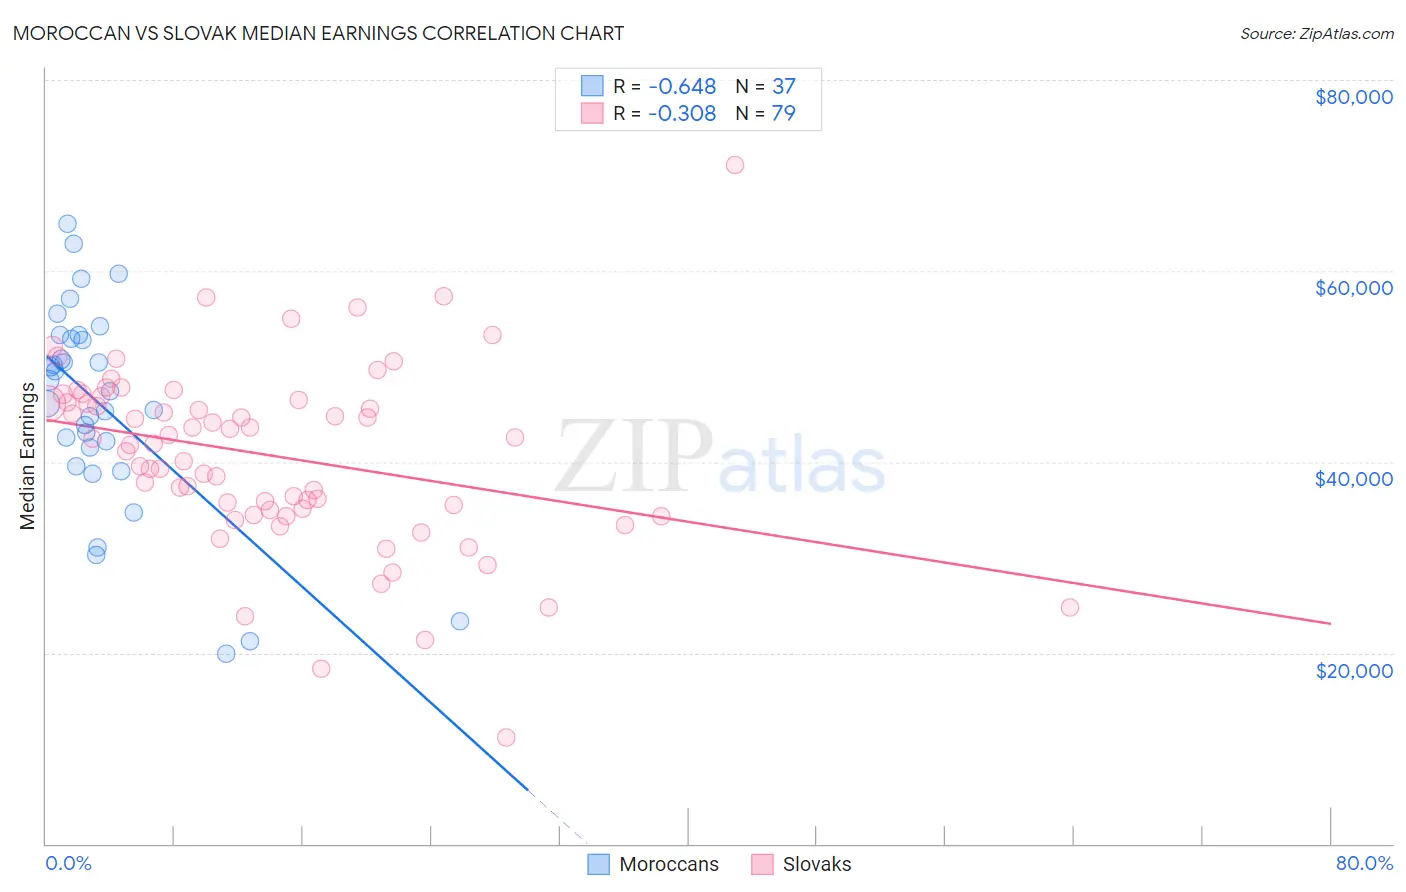
Moroccan vs Slovak Median Earnings Correlation Chart
The statistical analysis conducted on geographies consisting of 201,800,770 people shows a significant negative correlation between the proportion of Moroccans and median earnings in the United States with a correlation coefficient (R) of -0.648 and weighted average of $48,838. Similarly, the statistical analysis conducted on geographies consisting of 397,848,187 people shows a mild negative correlation between the proportion of Slovaks and median earnings in the United States with a correlation coefficient (R) of -0.308 and weighted average of $47,095, a difference of 3.7%.
Median Earnings Correlation Summary
| Measurement | Moroccan | Slovak |
| Minimum | $19,886 | $11,076 |
| Maximum | $64,979 | $71,150 |
| Range | $45,093 | $60,074 |
| Mean | $45,820 | $40,661 |
| Median | $47,333 | $41,901 |
| Interquartile 25% (IQ1) | $40,473 | $35,020 |
| Interquartile 75% (IQ3) | $53,052 | $46,429 |
| Interquartile Range (IQR) | $12,578 | $11,409 |
| Standard Deviation (Sample) | $10,819 | $9,606 |
| Standard Deviation (Population) | $10,672 | $9,545 |
Similar Demographics by Median Earnings
Demographics Similar to Moroccans by Median Earnings
In terms of median earnings, the demographic groups most similar to Moroccans are Chinese ($48,836, a difference of 0.010%), Immigrants from Kuwait ($48,861, a difference of 0.050%), Northern European ($48,887, a difference of 0.10%), Immigrants from Zimbabwe ($48,913, a difference of 0.15%), and Immigrants from Ethiopia ($48,924, a difference of 0.17%).
| Demographics | Rating | Rank | Median Earnings |
| Immigrants | Morocco | 98.4 /100 | #107 | Exceptional $49,368 |
| Palestinians | 98.0 /100 | #108 | Exceptional $49,209 |
| Syrians | 97.1 /100 | #109 | Exceptional $48,934 |
| Immigrants | Ethiopia | 97.1 /100 | #110 | Exceptional $48,924 |
| Immigrants | Zimbabwe | 97.0 /100 | #111 | Exceptional $48,913 |
| Northern Europeans | 96.9 /100 | #112 | Exceptional $48,887 |
| Immigrants | Kuwait | 96.8 /100 | #113 | Exceptional $48,861 |
| Moroccans | 96.7 /100 | #114 | Exceptional $48,838 |
| Chinese | 96.7 /100 | #115 | Exceptional $48,836 |
| Koreans | 96.2 /100 | #116 | Exceptional $48,727 |
| Serbians | 95.9 /100 | #117 | Exceptional $48,677 |
| Immigrants | Jordan | 95.9 /100 | #118 | Exceptional $48,673 |
| Poles | 95.8 /100 | #119 | Exceptional $48,659 |
| Carpatho Rusyns | 95.5 /100 | #120 | Exceptional $48,617 |
| Arabs | 95.4 /100 | #121 | Exceptional $48,599 |
Demographics Similar to Slovaks by Median Earnings
In terms of median earnings, the demographic groups most similar to Slovaks are Immigrants from Peru ($47,025, a difference of 0.15%), Alsatian ($47,023, a difference of 0.15%), Czech ($47,221, a difference of 0.27%), Immigrants from Eastern Africa ($46,969, a difference of 0.27%), and South American Indian ($46,952, a difference of 0.31%).
| Demographics | Rating | Rank | Median Earnings |
| Immigrants | Oceania | 84.1 /100 | #151 | Excellent $47,617 |
| Immigrants | Germany | 83.1 /100 | #152 | Excellent $47,566 |
| Slavs | 81.1 /100 | #153 | Excellent $47,470 |
| Immigrants | Portugal | 77.3 /100 | #154 | Good $47,304 |
| Immigrants | Vietnam | 76.7 /100 | #155 | Good $47,282 |
| Irish | 76.6 /100 | #156 | Good $47,276 |
| Czechs | 75.1 /100 | #157 | Good $47,221 |
| Slovaks | 71.7 /100 | #158 | Good $47,095 |
| Immigrants | Peru | 69.6 /100 | #159 | Good $47,025 |
| Alsatians | 69.6 /100 | #160 | Good $47,023 |
| Immigrants | Eastern Africa | 68.0 /100 | #161 | Good $46,969 |
| South American Indians | 67.4 /100 | #162 | Good $46,952 |
| Icelanders | 66.3 /100 | #163 | Good $46,916 |
| Norwegians | 64.7 /100 | #164 | Good $46,865 |
| South Americans | 62.7 /100 | #165 | Good $46,804 |