Moroccan vs Canadian Average Family Size
COMPARE
Moroccan
Canadian
Average Family Size
Average Family Size Comparison
Moroccans
Canadians
3.22
AVERAGE FAMILY SIZE
44.2/ 100
METRIC RATING
182nd/ 347
METRIC RANK
3.14
AVERAGE FAMILY SIZE
0.2/ 100
METRIC RATING
299th/ 347
METRIC RANK
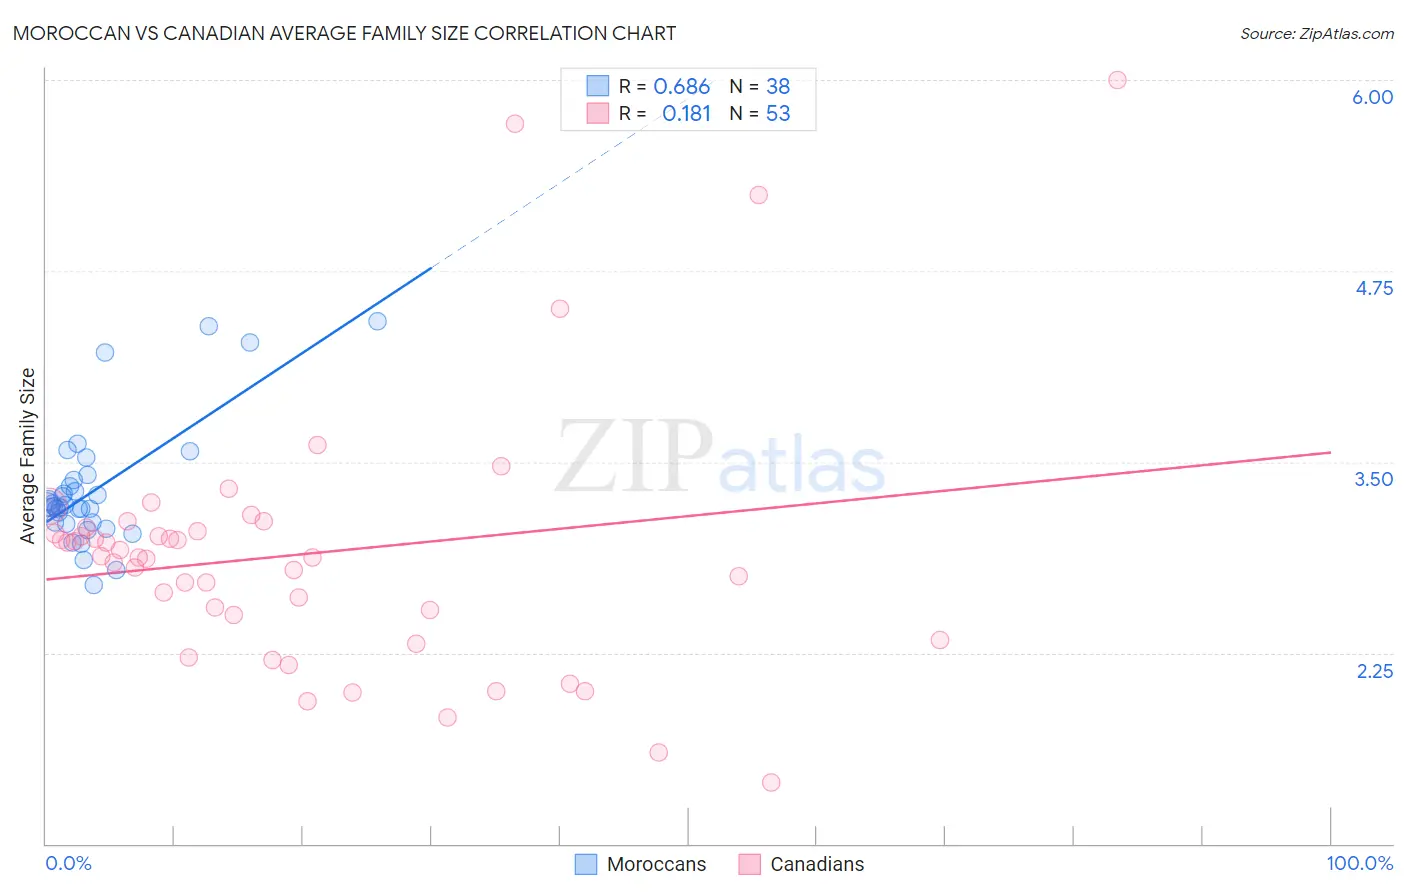
Moroccan vs Canadian Average Family Size Correlation Chart
The statistical analysis conducted on geographies consisting of 201,760,507 people shows a significant positive correlation between the proportion of Moroccans and average family size in the United States with a correlation coefficient (R) of 0.686 and weighted average of 3.22. Similarly, the statistical analysis conducted on geographies consisting of 437,289,019 people shows a poor positive correlation between the proportion of Canadians and average family size in the United States with a correlation coefficient (R) of 0.181 and weighted average of 3.14, a difference of 2.8%.
Average Family Size Correlation Summary
| Measurement | Moroccan | Canadian |
| Minimum | 2.69 | 1.40 |
| Maximum | 4.42 | 6.00 |
| Range | 1.73 | 4.60 |
| Mean | 3.32 | 2.90 |
| Median | 3.21 | 2.87 |
| Interquartile 25% (IQ1) | 3.10 | 2.42 |
| Interquartile 75% (IQ3) | 3.38 | 3.06 |
| Interquartile Range (IQR) | 0.28 | 0.64 |
| Standard Deviation (Sample) | 0.40 | 0.87 |
| Standard Deviation (Population) | 0.40 | 0.86 |
Similar Demographics by Average Family Size
Demographics Similar to Moroccans by Average Family Size
In terms of average family size, the demographic groups most similar to Moroccans are Spanish (3.23, a difference of 0.010%), Palestinian (3.23, a difference of 0.040%), Spaniard (3.23, a difference of 0.050%), Immigrants from Korea (3.23, a difference of 0.050%), and Immigrants from Northern Africa (3.22, a difference of 0.050%).
| Demographics | Rating | Rank | Average Family Size |
| Immigrants | China | 49.9 /100 | #175 | Average 3.23 |
| Israelis | 48.7 /100 | #176 | Average 3.23 |
| Argentineans | 47.4 /100 | #177 | Average 3.23 |
| Spaniards | 47.2 /100 | #178 | Average 3.23 |
| Immigrants | Korea | 46.9 /100 | #179 | Average 3.23 |
| Palestinians | 46.6 /100 | #180 | Average 3.23 |
| Spanish | 44.8 /100 | #181 | Average 3.23 |
| Moroccans | 44.2 /100 | #182 | Average 3.22 |
| Immigrants | Northern Africa | 41.7 /100 | #183 | Average 3.22 |
| Immigrants | Eastern Asia | 40.8 /100 | #184 | Average 3.22 |
| Immigrants | Sri Lanka | 39.8 /100 | #185 | Fair 3.22 |
| Immigrants | Argentina | 39.8 /100 | #186 | Fair 3.22 |
| Immigrants | Malaysia | 39.0 /100 | #187 | Fair 3.22 |
| Thais | 38.3 /100 | #188 | Fair 3.22 |
| Pakistanis | 33.7 /100 | #189 | Fair 3.22 |
Demographics Similar to Canadians by Average Family Size
In terms of average family size, the demographic groups most similar to Canadians are Immigrants from Sweden (3.14, a difference of 0.010%), Austrian (3.14, a difference of 0.050%), Ukrainian (3.14, a difference of 0.050%), Immigrants from Western Europe (3.14, a difference of 0.050%), and Colville (3.14, a difference of 0.050%).
| Demographics | Rating | Rank | Average Family Size |
| Europeans | 0.2 /100 | #292 | Tragic 3.14 |
| Scandinavians | 0.2 /100 | #293 | Tragic 3.14 |
| Immigrants | Croatia | 0.2 /100 | #294 | Tragic 3.14 |
| Austrians | 0.2 /100 | #295 | Tragic 3.14 |
| Ukrainians | 0.2 /100 | #296 | Tragic 3.14 |
| Immigrants | Western Europe | 0.2 /100 | #297 | Tragic 3.14 |
| Colville | 0.2 /100 | #298 | Tragic 3.14 |
| Canadians | 0.2 /100 | #299 | Tragic 3.14 |
| Immigrants | Sweden | 0.2 /100 | #300 | Tragic 3.14 |
| Macedonians | 0.2 /100 | #301 | Tragic 3.13 |
| Immigrants | Latvia | 0.2 /100 | #302 | Tragic 3.13 |
| British | 0.2 /100 | #303 | Tragic 3.13 |
| Immigrants | Switzerland | 0.2 /100 | #304 | Tragic 3.13 |
| Australians | 0.1 /100 | #305 | Tragic 3.13 |
| Immigrants | Ireland | 0.1 /100 | #306 | Tragic 3.13 |