Moroccan vs Osage Average Family Size
COMPARE
Moroccan
Osage
Average Family Size
Average Family Size Comparison
Moroccans
Osage
3.22
AVERAGE FAMILY SIZE
44.2/ 100
METRIC RATING
182nd/ 347
METRIC RANK
3.18
AVERAGE FAMILY SIZE
3.2/ 100
METRIC RATING
240th/ 347
METRIC RANK
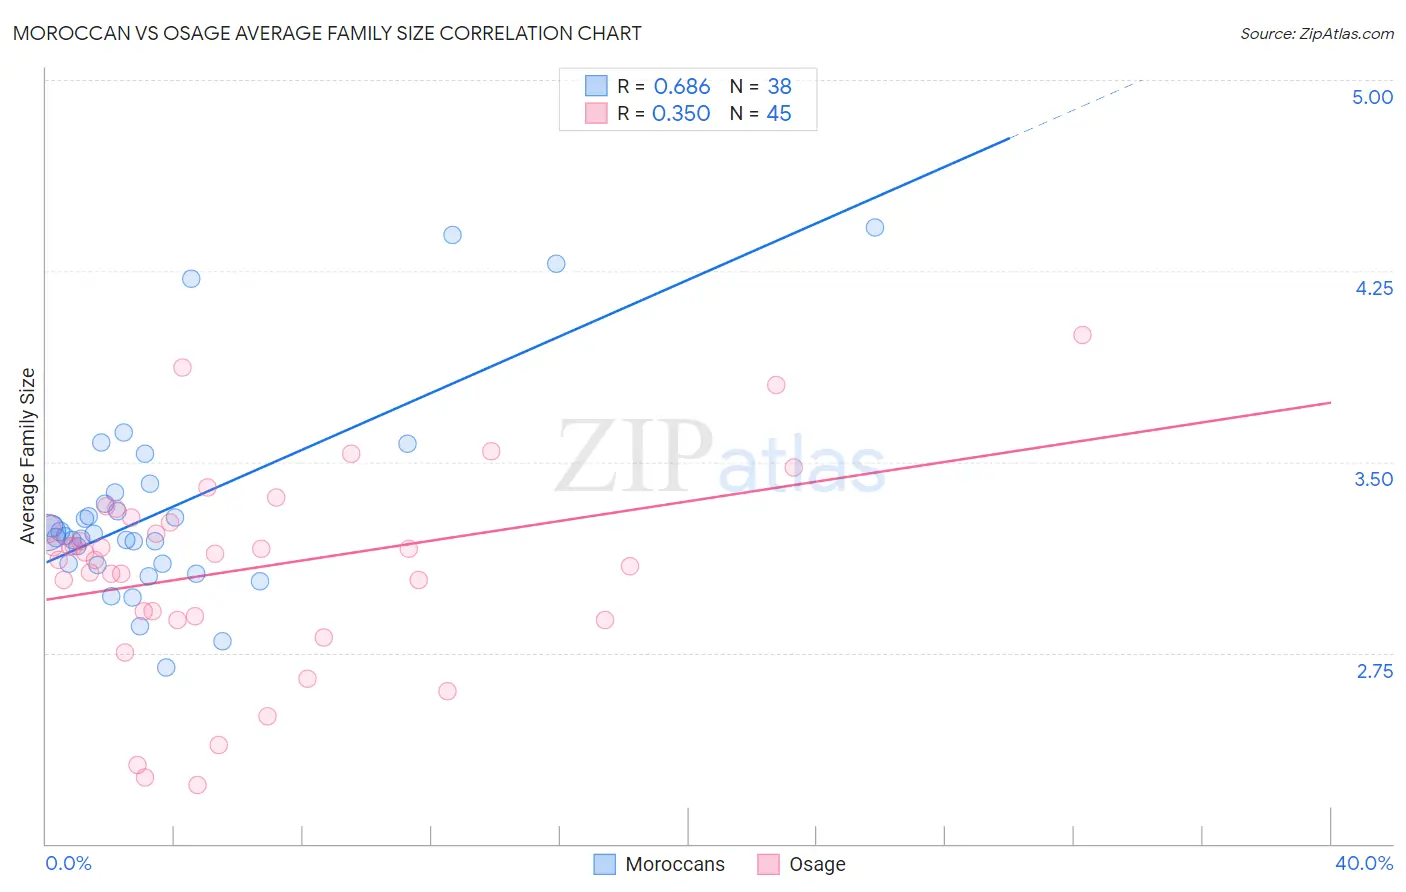
Moroccan vs Osage Average Family Size Correlation Chart
The statistical analysis conducted on geographies consisting of 201,760,507 people shows a significant positive correlation between the proportion of Moroccans and average family size in the United States with a correlation coefficient (R) of 0.686 and weighted average of 3.22. Similarly, the statistical analysis conducted on geographies consisting of 91,797,548 people shows a mild positive correlation between the proportion of Osage and average family size in the United States with a correlation coefficient (R) of 0.350 and weighted average of 3.18, a difference of 1.5%.
Average Family Size Correlation Summary
| Measurement | Moroccan | Osage |
| Minimum | 2.69 | 2.23 |
| Maximum | 4.42 | 4.00 |
| Range | 1.73 | 1.77 |
| Mean | 3.32 | 3.08 |
| Median | 3.21 | 3.14 |
| Interquartile 25% (IQ1) | 3.10 | 2.89 |
| Interquartile 75% (IQ3) | 3.38 | 3.27 |
| Interquartile Range (IQR) | 0.28 | 0.38 |
| Standard Deviation (Sample) | 0.40 | 0.39 |
| Standard Deviation (Population) | 0.40 | 0.38 |
Similar Demographics by Average Family Size
Demographics Similar to Moroccans by Average Family Size
In terms of average family size, the demographic groups most similar to Moroccans are Spanish (3.23, a difference of 0.010%), Palestinian (3.23, a difference of 0.040%), Spaniard (3.23, a difference of 0.050%), Immigrants from Korea (3.23, a difference of 0.050%), and Immigrants from Northern Africa (3.22, a difference of 0.050%).
| Demographics | Rating | Rank | Average Family Size |
| Immigrants | China | 49.9 /100 | #175 | Average 3.23 |
| Israelis | 48.7 /100 | #176 | Average 3.23 |
| Argentineans | 47.4 /100 | #177 | Average 3.23 |
| Spaniards | 47.2 /100 | #178 | Average 3.23 |
| Immigrants | Korea | 46.9 /100 | #179 | Average 3.23 |
| Palestinians | 46.6 /100 | #180 | Average 3.23 |
| Spanish | 44.8 /100 | #181 | Average 3.23 |
| Moroccans | 44.2 /100 | #182 | Average 3.22 |
| Immigrants | Northern Africa | 41.7 /100 | #183 | Average 3.22 |
| Immigrants | Eastern Asia | 40.8 /100 | #184 | Average 3.22 |
| Immigrants | Sri Lanka | 39.8 /100 | #185 | Fair 3.22 |
| Immigrants | Argentina | 39.8 /100 | #186 | Fair 3.22 |
| Immigrants | Malaysia | 39.0 /100 | #187 | Fair 3.22 |
| Thais | 38.3 /100 | #188 | Fair 3.22 |
| Pakistanis | 33.7 /100 | #189 | Fair 3.22 |
Demographics Similar to Osage by Average Family Size
In terms of average family size, the demographic groups most similar to Osage are Houma (3.18, a difference of 0.020%), Immigrants from Japan (3.18, a difference of 0.020%), Hungarian (3.18, a difference of 0.040%), Immigrants from Moldova (3.18, a difference of 0.040%), and Immigrants from Southern Europe (3.18, a difference of 0.050%).
| Demographics | Rating | Rank | Average Family Size |
| Brazilians | 4.5 /100 | #233 | Tragic 3.18 |
| Iranians | 4.5 /100 | #234 | Tragic 3.18 |
| Immigrants | Turkey | 4.2 /100 | #235 | Tragic 3.18 |
| Immigrants | Portugal | 4.2 /100 | #236 | Tragic 3.18 |
| Immigrants | Romania | 3.7 /100 | #237 | Tragic 3.18 |
| Romanians | 3.7 /100 | #238 | Tragic 3.18 |
| Houma | 3.4 /100 | #239 | Tragic 3.18 |
| Osage | 3.2 /100 | #240 | Tragic 3.18 |
| Immigrants | Japan | 3.0 /100 | #241 | Tragic 3.18 |
| Hungarians | 3.0 /100 | #242 | Tragic 3.18 |
| Immigrants | Moldova | 2.9 /100 | #243 | Tragic 3.18 |
| Immigrants | Southern Europe | 2.9 /100 | #244 | Tragic 3.18 |
| Immigrants | Brazil | 2.7 /100 | #245 | Tragic 3.18 |
| Danes | 2.5 /100 | #246 | Tragic 3.17 |
| Cajuns | 2.4 /100 | #247 | Tragic 3.17 |