Mongolian vs Immigrants from Canada Divorced or Separated
COMPARE
Mongolian
Immigrants from Canada
Divorced or Separated
Divorced or Separated Comparison
Mongolians
Immigrants from Canada
11.1%
DIVORCED OR SEPARATED
100.0/ 100
METRIC RATING
31st/ 347
METRIC RANK
12.1%
DIVORCED OR SEPARATED
44.0/ 100
METRIC RATING
181st/ 347
METRIC RANK
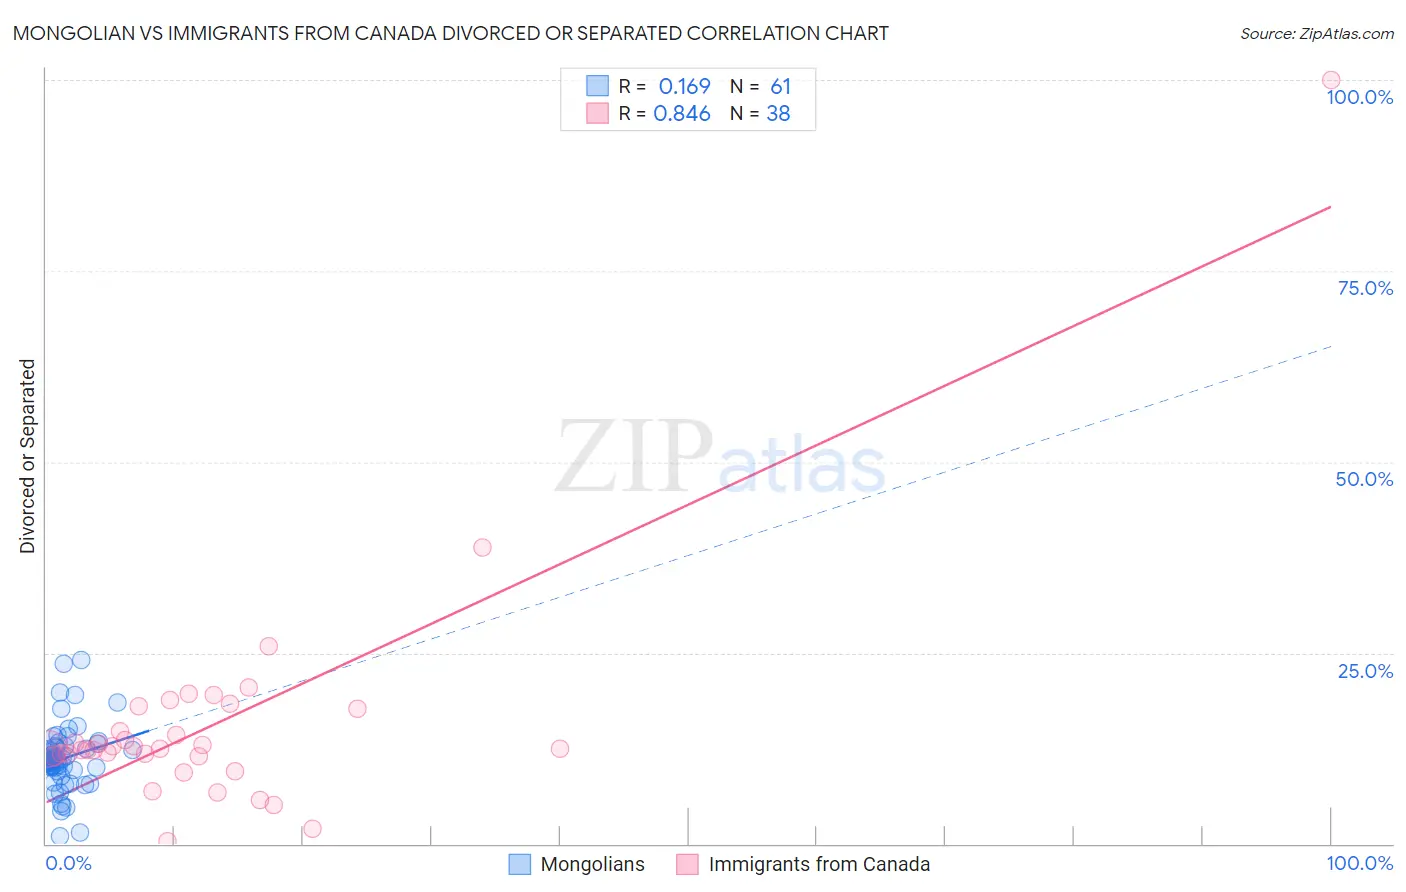
Mongolian vs Immigrants from Canada Divorced or Separated Correlation Chart
The statistical analysis conducted on geographies consisting of 140,326,151 people shows a poor positive correlation between the proportion of Mongolians and percentage of population currently divorced or separated in the United States with a correlation coefficient (R) of 0.169 and weighted average of 11.1%. Similarly, the statistical analysis conducted on geographies consisting of 459,212,003 people shows a very strong positive correlation between the proportion of Immigrants from Canada and percentage of population currently divorced or separated in the United States with a correlation coefficient (R) of 0.846 and weighted average of 12.1%, a difference of 9.2%.
Divorced or Separated Correlation Summary
| Measurement | Mongolian | Immigrants from Canada |
| Minimum | 1.0% | 0.33% |
| Maximum | 24.0% | 100.0% |
| Range | 23.0% | 99.7% |
| Mean | 11.2% | 15.6% |
| Median | 10.9% | 12.5% |
| Interquartile 25% (IQ1) | 9.5% | 11.5% |
| Interquartile 75% (IQ3) | 12.8% | 17.6% |
| Interquartile Range (IQR) | 3.3% | 6.1% |
| Standard Deviation (Sample) | 4.3% | 15.5% |
| Standard Deviation (Population) | 4.3% | 15.3% |
Similar Demographics by Divorced or Separated
Demographics Similar to Mongolians by Divorced or Separated
In terms of divorced or separated, the demographic groups most similar to Mongolians are Tongan (11.1%, a difference of 0.080%), Egyptian (11.1%, a difference of 0.12%), Immigrants from Uzbekistan (11.1%, a difference of 0.19%), Cambodian (11.1%, a difference of 0.27%), and Immigrants from Ireland (11.0%, a difference of 0.30%).
| Demographics | Rating | Rank | Divorced or Separated |
| Immigrants | Sri Lanka | 100.0 /100 | #24 | Exceptional 10.8% |
| Iranians | 100.0 /100 | #25 | Exceptional 10.8% |
| Immigrants | Indonesia | 100.0 /100 | #26 | Exceptional 10.9% |
| Immigrants | Bangladesh | 100.0 /100 | #27 | Exceptional 11.0% |
| Immigrants | Malaysia | 100.0 /100 | #28 | Exceptional 11.0% |
| Armenians | 100.0 /100 | #29 | Exceptional 11.0% |
| Immigrants | Ireland | 100.0 /100 | #30 | Exceptional 11.0% |
| Mongolians | 100.0 /100 | #31 | Exceptional 11.1% |
| Tongans | 100.0 /100 | #32 | Exceptional 11.1% |
| Egyptians | 100.0 /100 | #33 | Exceptional 11.1% |
| Immigrants | Uzbekistan | 100.0 /100 | #34 | Exceptional 11.1% |
| Cambodians | 100.0 /100 | #35 | Exceptional 11.1% |
| Immigrants | Japan | 100.0 /100 | #36 | Exceptional 11.1% |
| Immigrants | Lebanon | 100.0 /100 | #37 | Exceptional 11.1% |
| Immigrants | Greece | 100.0 /100 | #38 | Exceptional 11.1% |
Demographics Similar to Immigrants from Canada by Divorced or Separated
In terms of divorced or separated, the demographic groups most similar to Immigrants from Canada are Barbadian (12.1%, a difference of 0.030%), Immigrants from Ethiopia (12.1%, a difference of 0.030%), Immigrants from Central America (12.1%, a difference of 0.040%), Immigrants from Western Europe (12.1%, a difference of 0.050%), and Ghanaian (12.1%, a difference of 0.060%).
| Demographics | Rating | Rank | Divorced or Separated |
| Hawaiians | 50.0 /100 | #174 | Average 12.1% |
| Immigrants | Sierra Leone | 50.0 /100 | #175 | Average 12.1% |
| Pennsylvania Germans | 48.9 /100 | #176 | Average 12.1% |
| Brazilians | 47.7 /100 | #177 | Average 12.1% |
| Ghanaians | 45.9 /100 | #178 | Average 12.1% |
| Immigrants | Western Europe | 45.6 /100 | #179 | Average 12.1% |
| Barbadians | 45.0 /100 | #180 | Average 12.1% |
| Immigrants | Canada | 44.0 /100 | #181 | Average 12.1% |
| Immigrants | Ethiopia | 43.1 /100 | #182 | Average 12.1% |
| Immigrants | Central America | 42.9 /100 | #183 | Average 12.1% |
| Immigrants | North America | 41.1 /100 | #184 | Average 12.1% |
| Immigrants | Nigeria | 40.5 /100 | #185 | Average 12.1% |
| Immigrants | Chile | 39.0 /100 | #186 | Fair 12.1% |
| Belizeans | 37.7 /100 | #187 | Fair 12.1% |
| Immigrants | Belize | 37.6 /100 | #188 | Fair 12.1% |