Mongolian vs Spanish American Divorced or Separated
COMPARE
Mongolian
Spanish American
Divorced or Separated
Divorced or Separated Comparison
Mongolians
Spanish Americans
11.1%
DIVORCED OR SEPARATED
100.0/ 100
METRIC RATING
31st/ 347
METRIC RANK
13.3%
DIVORCED OR SEPARATED
0.0/ 100
METRIC RATING
315th/ 347
METRIC RANK
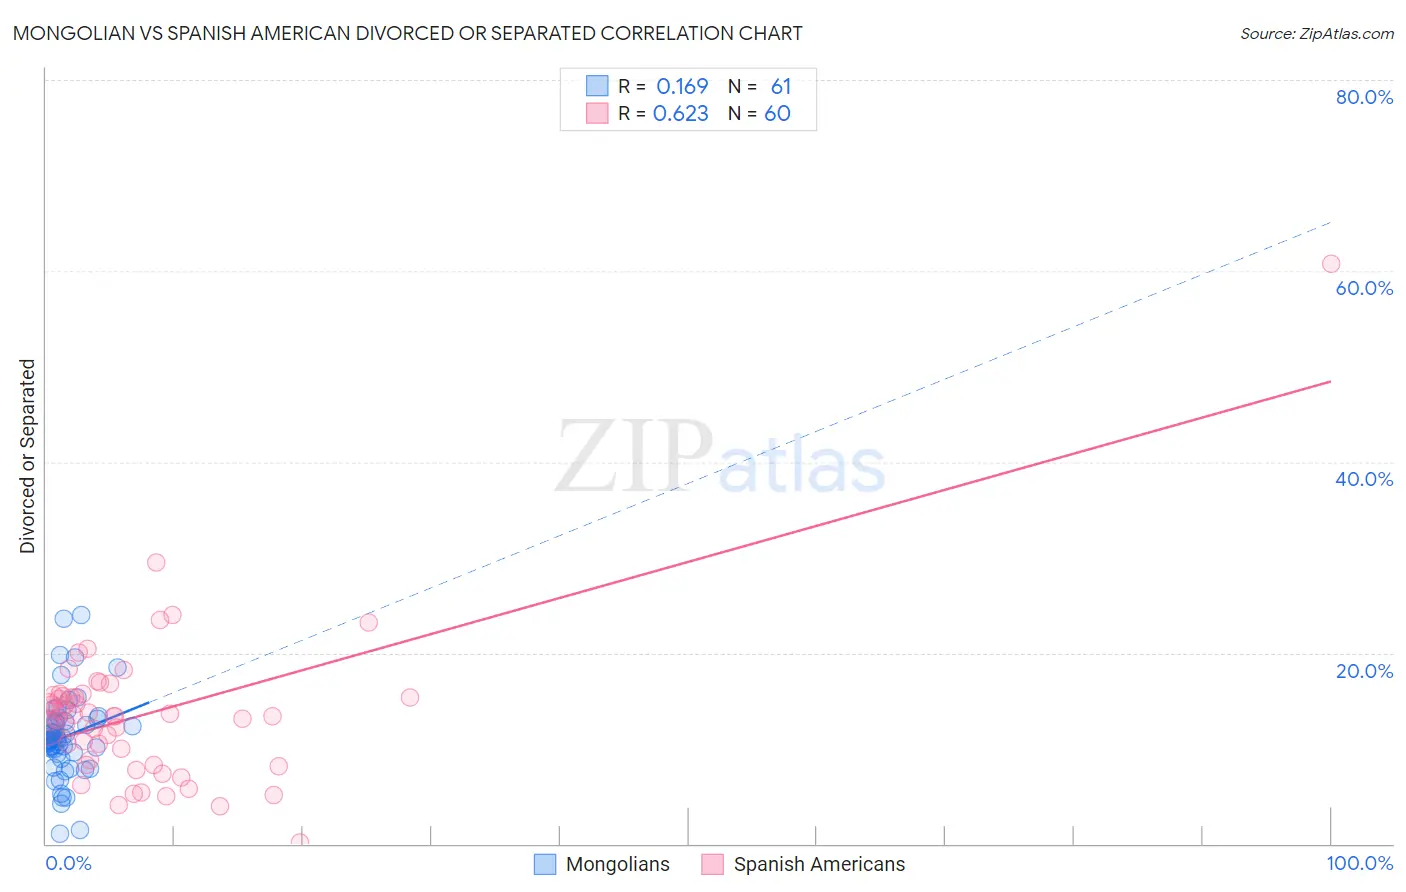
Mongolian vs Spanish American Divorced or Separated Correlation Chart
The statistical analysis conducted on geographies consisting of 140,326,151 people shows a poor positive correlation between the proportion of Mongolians and percentage of population currently divorced or separated in the United States with a correlation coefficient (R) of 0.169 and weighted average of 11.1%. Similarly, the statistical analysis conducted on geographies consisting of 103,168,591 people shows a significant positive correlation between the proportion of Spanish Americans and percentage of population currently divorced or separated in the United States with a correlation coefficient (R) of 0.623 and weighted average of 13.3%, a difference of 20.6%.
Divorced or Separated Correlation Summary
| Measurement | Mongolian | Spanish American |
| Minimum | 1.0% | 0.10% |
| Maximum | 24.0% | 60.7% |
| Range | 23.0% | 60.6% |
| Mean | 11.2% | 13.6% |
| Median | 10.9% | 13.4% |
| Interquartile 25% (IQ1) | 9.5% | 8.5% |
| Interquartile 75% (IQ3) | 12.8% | 15.6% |
| Interquartile Range (IQR) | 3.3% | 7.0% |
| Standard Deviation (Sample) | 4.3% | 8.2% |
| Standard Deviation (Population) | 4.3% | 8.2% |
Similar Demographics by Divorced or Separated
Demographics Similar to Mongolians by Divorced or Separated
In terms of divorced or separated, the demographic groups most similar to Mongolians are Tongan (11.1%, a difference of 0.080%), Egyptian (11.1%, a difference of 0.12%), Immigrants from Uzbekistan (11.1%, a difference of 0.19%), Cambodian (11.1%, a difference of 0.27%), and Immigrants from Ireland (11.0%, a difference of 0.30%).
| Demographics | Rating | Rank | Divorced or Separated |
| Immigrants | Sri Lanka | 100.0 /100 | #24 | Exceptional 10.8% |
| Iranians | 100.0 /100 | #25 | Exceptional 10.8% |
| Immigrants | Indonesia | 100.0 /100 | #26 | Exceptional 10.9% |
| Immigrants | Bangladesh | 100.0 /100 | #27 | Exceptional 11.0% |
| Immigrants | Malaysia | 100.0 /100 | #28 | Exceptional 11.0% |
| Armenians | 100.0 /100 | #29 | Exceptional 11.0% |
| Immigrants | Ireland | 100.0 /100 | #30 | Exceptional 11.0% |
| Mongolians | 100.0 /100 | #31 | Exceptional 11.1% |
| Tongans | 100.0 /100 | #32 | Exceptional 11.1% |
| Egyptians | 100.0 /100 | #33 | Exceptional 11.1% |
| Immigrants | Uzbekistan | 100.0 /100 | #34 | Exceptional 11.1% |
| Cambodians | 100.0 /100 | #35 | Exceptional 11.1% |
| Immigrants | Japan | 100.0 /100 | #36 | Exceptional 11.1% |
| Immigrants | Lebanon | 100.0 /100 | #37 | Exceptional 11.1% |
| Immigrants | Greece | 100.0 /100 | #38 | Exceptional 11.1% |
Demographics Similar to Spanish Americans by Divorced or Separated
In terms of divorced or separated, the demographic groups most similar to Spanish Americans are Tsimshian (13.3%, a difference of 0.030%), Haitian (13.3%, a difference of 0.050%), Cree (13.4%, a difference of 0.080%), Puget Sound Salish (13.4%, a difference of 0.12%), and Cajun (13.4%, a difference of 0.18%).
| Demographics | Rating | Rank | Divorced or Separated |
| Ottawa | 0.0 /100 | #308 | Tragic 13.2% |
| Americans | 0.0 /100 | #309 | Tragic 13.2% |
| Africans | 0.0 /100 | #310 | Tragic 13.2% |
| Sioux | 0.0 /100 | #311 | Tragic 13.2% |
| Blackfeet | 0.0 /100 | #312 | Tragic 13.3% |
| Immigrants | Nicaragua | 0.0 /100 | #313 | Tragic 13.3% |
| Yaqui | 0.0 /100 | #314 | Tragic 13.3% |
| Spanish Americans | 0.0 /100 | #315 | Tragic 13.3% |
| Tsimshian | 0.0 /100 | #316 | Tragic 13.3% |
| Haitians | 0.0 /100 | #317 | Tragic 13.3% |
| Cree | 0.0 /100 | #318 | Tragic 13.4% |
| Puget Sound Salish | 0.0 /100 | #319 | Tragic 13.4% |
| Cajuns | 0.0 /100 | #320 | Tragic 13.4% |
| Cheyenne | 0.0 /100 | #321 | Tragic 13.4% |
| Immigrants | Haiti | 0.0 /100 | #322 | Tragic 13.4% |