Mongolian vs Immigrants from Canada Householder Income Ages 25 - 44 years
COMPARE
Mongolian
Immigrants from Canada
Householder Income Ages 25 - 44 years
Householder Income Ages 25 - 44 years Comparison
Mongolians
Immigrants from Canada
$104,578
HOUSEHOLDER INCOME AGES 25 - 44 YEARS
99.6/ 100
METRIC RATING
69th/ 347
METRIC RANK
$102,616
HOUSEHOLDER INCOME AGES 25 - 44 YEARS
98.9/ 100
METRIC RATING
88th/ 347
METRIC RANK
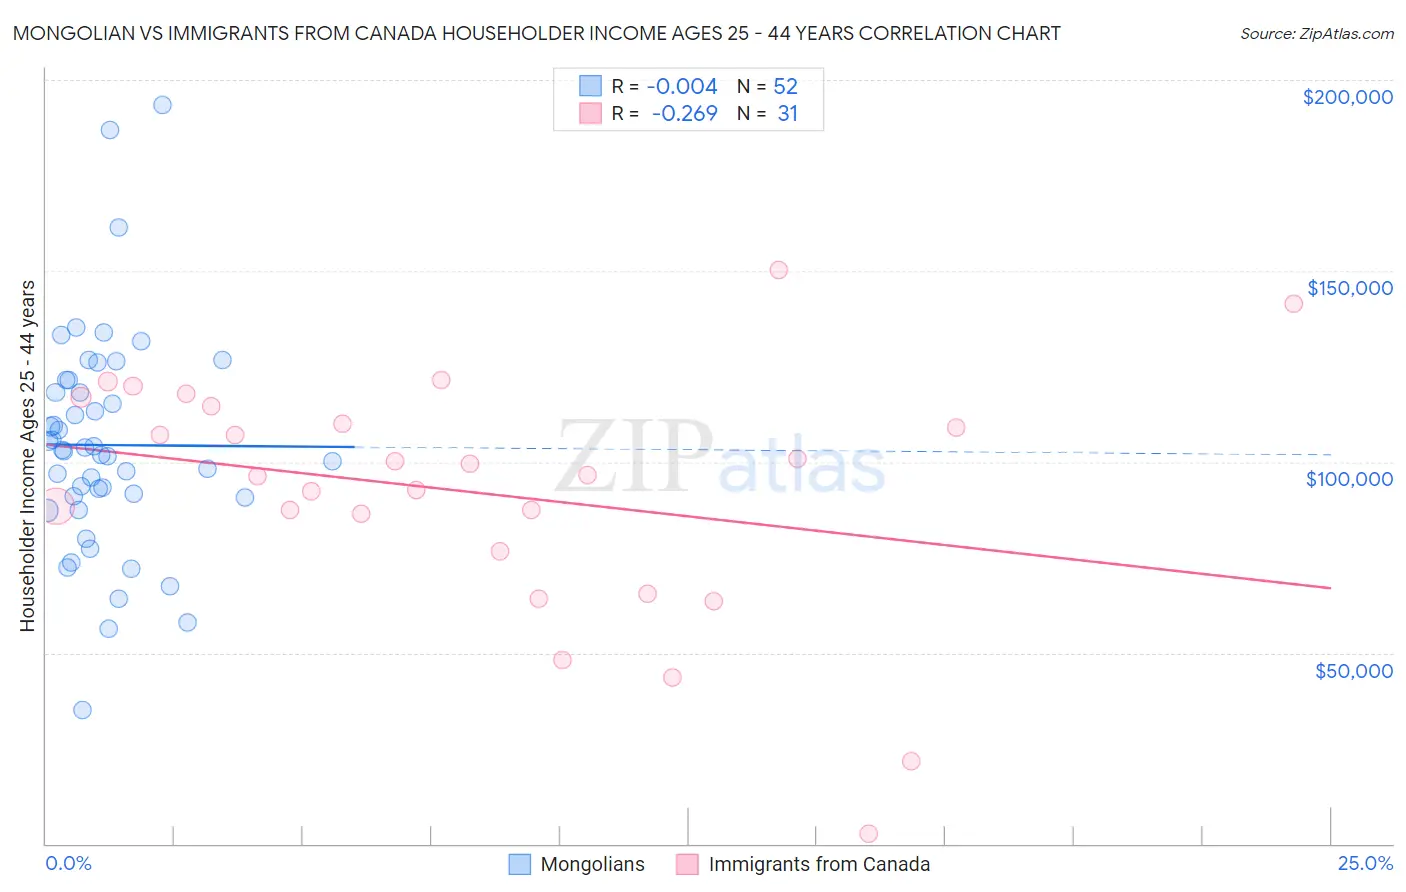
Mongolian vs Immigrants from Canada Householder Income Ages 25 - 44 years Correlation Chart
The statistical analysis conducted on geographies consisting of 140,220,611 people shows no correlation between the proportion of Mongolians and household income with householder between the ages 25 and 44 in the United States with a correlation coefficient (R) of -0.004 and weighted average of $104,578. Similarly, the statistical analysis conducted on geographies consisting of 457,590,817 people shows a weak negative correlation between the proportion of Immigrants from Canada and household income with householder between the ages 25 and 44 in the United States with a correlation coefficient (R) of -0.269 and weighted average of $102,616, a difference of 1.9%.
Householder Income Ages 25 - 44 years Correlation Summary
| Measurement | Mongolian | Immigrants from Canada |
| Minimum | $34,868 | $2,499 |
| Maximum | $193,482 | $150,179 |
| Range | $158,614 | $147,680 |
| Mean | $104,434 | $91,907 |
| Median | $103,048 | $96,656 |
| Interquartile 25% (IQ1) | $90,782 | $76,535 |
| Interquartile 75% (IQ3) | $119,894 | $114,617 |
| Interquartile Range (IQR) | $29,113 | $38,082 |
| Standard Deviation (Sample) | $29,028 | $32,277 |
| Standard Deviation (Population) | $28,748 | $31,752 |
Demographics Similar to Mongolians and Immigrants from Canada by Householder Income Ages 25 - 44 years
In terms of householder income ages 25 - 44 years, the demographic groups most similar to Mongolians are Immigrants from Croatia ($104,503, a difference of 0.070%), Immigrants from Eastern Europe ($104,662, a difference of 0.080%), Afghan ($104,410, a difference of 0.16%), Chinese ($104,264, a difference of 0.30%), and Italian ($104,215, a difference of 0.35%). Similarly, the demographic groups most similar to Immigrants from Canada are Immigrants from Hungary ($102,655, a difference of 0.040%), Immigrants from Western Europe ($102,654, a difference of 0.040%), Immigrants from Ukraine ($102,664, a difference of 0.050%), Immigrants from Philippines ($102,910, a difference of 0.29%), and Argentinean ($103,111, a difference of 0.48%).
| Demographics | Rating | Rank | Householder Income Ages 25 - 44 years |
| Immigrants | Eastern Europe | 99.6 /100 | #68 | Exceptional $104,662 |
| Mongolians | 99.6 /100 | #69 | Exceptional $104,578 |
| Immigrants | Croatia | 99.6 /100 | #70 | Exceptional $104,503 |
| Afghans | 99.6 /100 | #71 | Exceptional $104,410 |
| Chinese | 99.5 /100 | #72 | Exceptional $104,264 |
| Italians | 99.5 /100 | #73 | Exceptional $104,215 |
| Immigrants | Fiji | 99.5 /100 | #74 | Exceptional $103,954 |
| Koreans | 99.4 /100 | #75 | Exceptional $103,824 |
| Immigrants | Spain | 99.4 /100 | #76 | Exceptional $103,752 |
| Immigrants | Southern Europe | 99.3 /100 | #77 | Exceptional $103,486 |
| Immigrants | Bulgaria | 99.3 /100 | #78 | Exceptional $103,423 |
| Armenians | 99.2 /100 | #79 | Exceptional $103,248 |
| Immigrants | Egypt | 99.2 /100 | #80 | Exceptional $103,192 |
| South Africans | 99.2 /100 | #81 | Exceptional $103,160 |
| Immigrants | Serbia | 99.2 /100 | #82 | Exceptional $103,155 |
| Argentineans | 99.1 /100 | #83 | Exceptional $103,111 |
| Immigrants | Philippines | 99.0 /100 | #84 | Exceptional $102,910 |
| Immigrants | Ukraine | 98.9 /100 | #85 | Exceptional $102,664 |
| Immigrants | Hungary | 98.9 /100 | #86 | Exceptional $102,655 |
| Immigrants | Western Europe | 98.9 /100 | #87 | Exceptional $102,654 |
| Immigrants | Canada | 98.9 /100 | #88 | Exceptional $102,616 |