Mongolian vs Pueblo Divorced or Separated
COMPARE
Mongolian
Pueblo
Divorced or Separated
Divorced or Separated Comparison
Mongolians
Pueblo
11.1%
DIVORCED OR SEPARATED
100.0/ 100
METRIC RATING
31st/ 347
METRIC RANK
12.7%
DIVORCED OR SEPARATED
0.2/ 100
METRIC RATING
281st/ 347
METRIC RANK
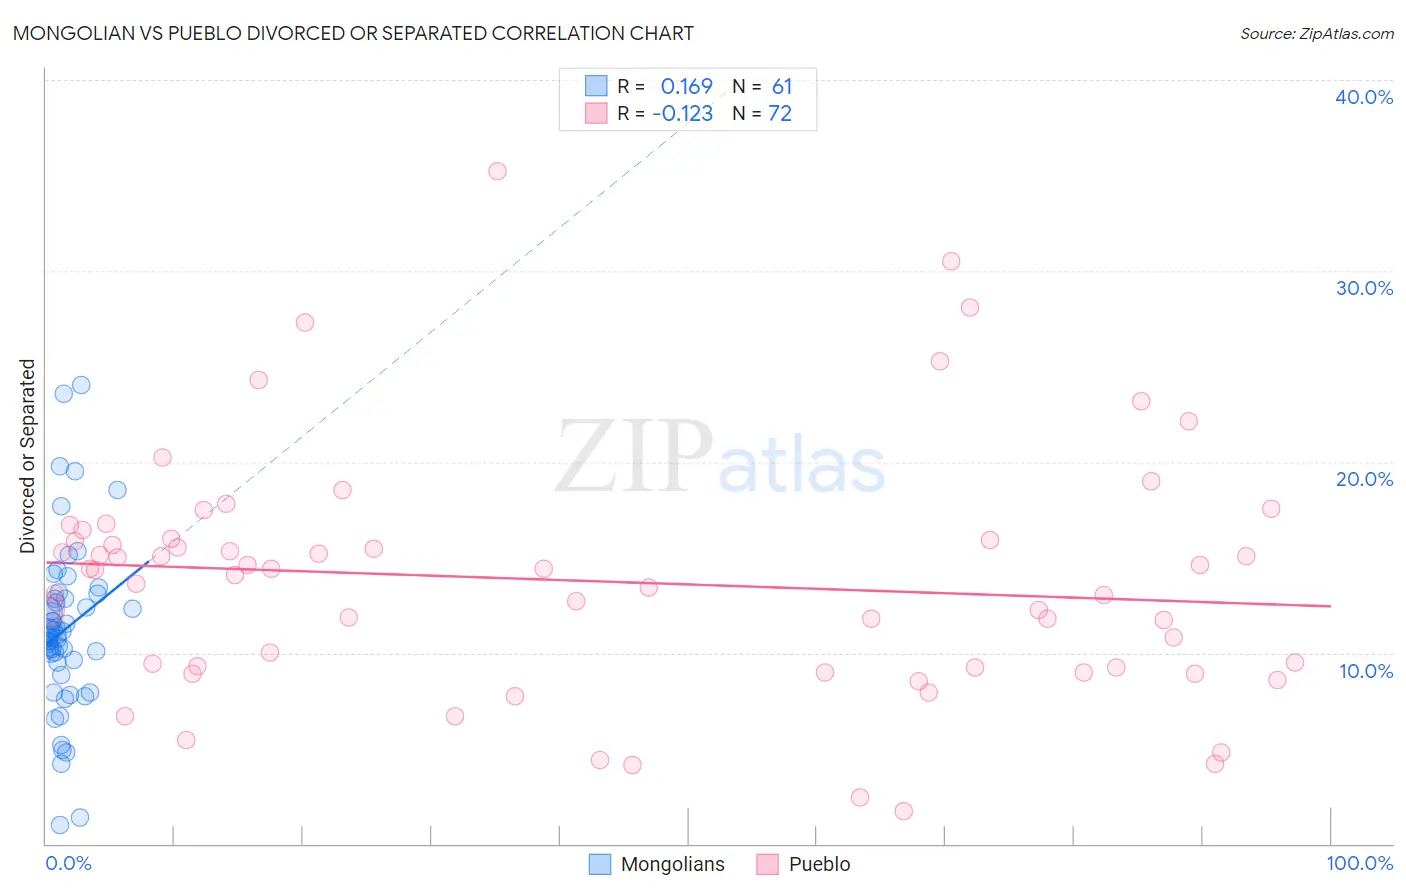
Mongolian vs Pueblo Divorced or Separated Correlation Chart
The statistical analysis conducted on geographies consisting of 140,326,151 people shows a poor positive correlation between the proportion of Mongolians and percentage of population currently divorced or separated in the United States with a correlation coefficient (R) of 0.169 and weighted average of 11.1%. Similarly, the statistical analysis conducted on geographies consisting of 120,078,474 people shows a poor negative correlation between the proportion of Pueblo and percentage of population currently divorced or separated in the United States with a correlation coefficient (R) of -0.123 and weighted average of 12.7%, a difference of 15.0%.
Divorced or Separated Correlation Summary
| Measurement | Mongolian | Pueblo |
| Minimum | 1.0% | 1.7% |
| Maximum | 24.0% | 35.2% |
| Range | 23.0% | 33.5% |
| Mean | 11.2% | 13.8% |
| Median | 10.9% | 14.2% |
| Interquartile 25% (IQ1) | 9.5% | 9.2% |
| Interquartile 75% (IQ3) | 12.8% | 16.0% |
| Interquartile Range (IQR) | 3.3% | 6.7% |
| Standard Deviation (Sample) | 4.3% | 6.4% |
| Standard Deviation (Population) | 4.3% | 6.3% |
Similar Demographics by Divorced or Separated
Demographics Similar to Mongolians by Divorced or Separated
In terms of divorced or separated, the demographic groups most similar to Mongolians are Tongan (11.1%, a difference of 0.080%), Egyptian (11.1%, a difference of 0.12%), Immigrants from Uzbekistan (11.1%, a difference of 0.19%), Cambodian (11.1%, a difference of 0.27%), and Immigrants from Ireland (11.0%, a difference of 0.30%).
| Demographics | Rating | Rank | Divorced or Separated |
| Immigrants | Sri Lanka | 100.0 /100 | #24 | Exceptional 10.8% |
| Iranians | 100.0 /100 | #25 | Exceptional 10.8% |
| Immigrants | Indonesia | 100.0 /100 | #26 | Exceptional 10.9% |
| Immigrants | Bangladesh | 100.0 /100 | #27 | Exceptional 11.0% |
| Immigrants | Malaysia | 100.0 /100 | #28 | Exceptional 11.0% |
| Armenians | 100.0 /100 | #29 | Exceptional 11.0% |
| Immigrants | Ireland | 100.0 /100 | #30 | Exceptional 11.0% |
| Mongolians | 100.0 /100 | #31 | Exceptional 11.1% |
| Tongans | 100.0 /100 | #32 | Exceptional 11.1% |
| Egyptians | 100.0 /100 | #33 | Exceptional 11.1% |
| Immigrants | Uzbekistan | 100.0 /100 | #34 | Exceptional 11.1% |
| Cambodians | 100.0 /100 | #35 | Exceptional 11.1% |
| Immigrants | Japan | 100.0 /100 | #36 | Exceptional 11.1% |
| Immigrants | Lebanon | 100.0 /100 | #37 | Exceptional 11.1% |
| Immigrants | Greece | 100.0 /100 | #38 | Exceptional 11.1% |
Demographics Similar to Pueblo by Divorced or Separated
In terms of divorced or separated, the demographic groups most similar to Pueblo are Immigrants from Zaire (12.7%, a difference of 0.040%), Lumbee (12.7%, a difference of 0.11%), Immigrants from Dominican Republic (12.7%, a difference of 0.11%), Subsaharan African (12.7%, a difference of 0.12%), and Delaware (12.7%, a difference of 0.13%).
| Demographics | Rating | Rank | Divorced or Separated |
| Bermudans | 0.3 /100 | #274 | Tragic 12.7% |
| Central American Indians | 0.3 /100 | #275 | Tragic 12.7% |
| Spaniards | 0.2 /100 | #276 | Tragic 12.7% |
| Dominicans | 0.2 /100 | #277 | Tragic 12.7% |
| Lumbee | 0.2 /100 | #278 | Tragic 12.7% |
| Immigrants | Dominican Republic | 0.2 /100 | #279 | Tragic 12.7% |
| Immigrants | Zaire | 0.2 /100 | #280 | Tragic 12.7% |
| Pueblo | 0.2 /100 | #281 | Tragic 12.7% |
| Sub-Saharan Africans | 0.1 /100 | #282 | Tragic 12.7% |
| Delaware | 0.1 /100 | #283 | Tragic 12.7% |
| Immigrants | Nonimmigrants | 0.1 /100 | #284 | Tragic 12.8% |
| French | 0.1 /100 | #285 | Tragic 12.8% |
| Spanish | 0.1 /100 | #286 | Tragic 12.8% |
| Hondurans | 0.1 /100 | #287 | Tragic 12.8% |
| French Canadians | 0.1 /100 | #288 | Tragic 12.8% |