Mongolian vs Immigrants from Canada Child Poverty Among Boys Under 16
COMPARE
Mongolian
Immigrants from Canada
Child Poverty Among Boys Under 16
Child Poverty Among Boys Under 16 Comparison
Mongolians
Immigrants from Canada
15.4%
CHILD POVERTY AMONG BOYS UNDER 16
90.2/ 100
METRIC RATING
130th/ 347
METRIC RANK
14.7%
CHILD POVERTY AMONG BOYS UNDER 16
97.6/ 100
METRIC RATING
81st/ 347
METRIC RANK
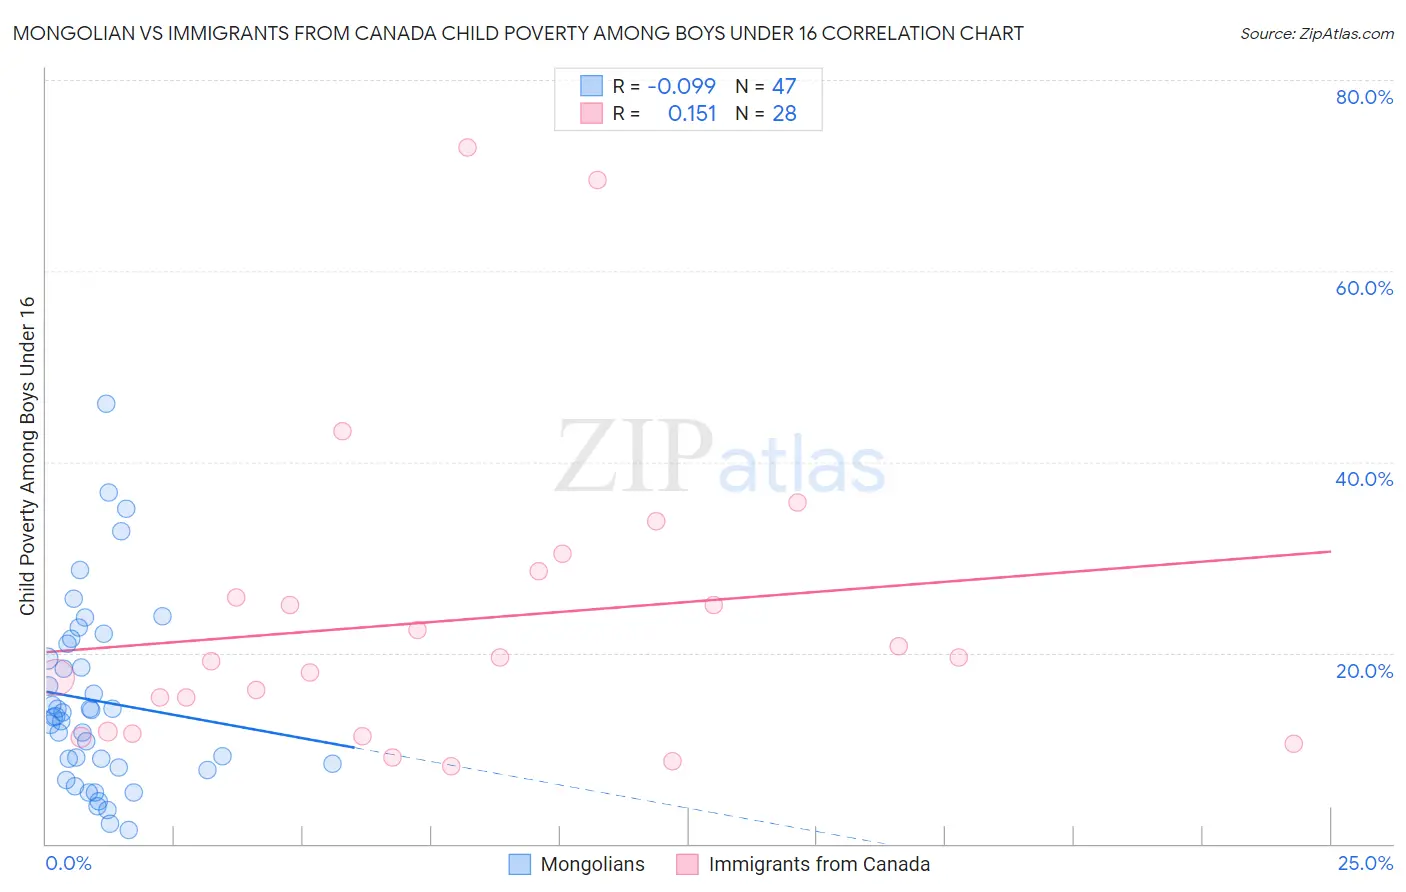
Mongolian vs Immigrants from Canada Child Poverty Among Boys Under 16 Correlation Chart
The statistical analysis conducted on geographies consisting of 139,635,947 people shows a slight negative correlation between the proportion of Mongolians and poverty level among boys under the age of 16 in the United States with a correlation coefficient (R) of -0.099 and weighted average of 15.4%. Similarly, the statistical analysis conducted on geographies consisting of 448,274,828 people shows a poor positive correlation between the proportion of Immigrants from Canada and poverty level among boys under the age of 16 in the United States with a correlation coefficient (R) of 0.151 and weighted average of 14.7%, a difference of 4.6%.
Child Poverty Among Boys Under 16 Correlation Summary
| Measurement | Mongolian | Immigrants from Canada |
| Minimum | 1.5% | 8.1% |
| Maximum | 46.2% | 72.9% |
| Range | 44.7% | 64.8% |
| Mean | 15.0% | 23.4% |
| Median | 13.4% | 19.3% |
| Interquartile 25% (IQ1) | 7.9% | 11.6% |
| Interquartile 75% (IQ3) | 21.0% | 27.2% |
| Interquartile Range (IQR) | 13.1% | 15.6% |
| Standard Deviation (Sample) | 9.7% | 16.1% |
| Standard Deviation (Population) | 9.6% | 15.8% |
Similar Demographics by Child Poverty Among Boys Under 16
Demographics Similar to Mongolians by Child Poverty Among Boys Under 16
In terms of child poverty among boys under 16, the demographic groups most similar to Mongolians are Immigrants from Brazil (15.4%, a difference of 0.020%), Immigrants from Western Europe (15.4%, a difference of 0.060%), Canadian (15.4%, a difference of 0.14%), Carpatho Rusyn (15.4%, a difference of 0.33%), and Palestinian (15.4%, a difference of 0.38%).
| Demographics | Rating | Rank | Child Poverty Among Boys Under 16 |
| Immigrants | Norway | 92.3 /100 | #123 | Exceptional 15.3% |
| Tlingit-Haida | 92.2 /100 | #124 | Exceptional 15.3% |
| Czechoslovakians | 92.1 /100 | #125 | Exceptional 15.3% |
| Palestinians | 91.3 /100 | #126 | Exceptional 15.4% |
| Carpatho Rusyns | 91.1 /100 | #127 | Exceptional 15.4% |
| Canadians | 90.6 /100 | #128 | Exceptional 15.4% |
| Immigrants | Brazil | 90.3 /100 | #129 | Exceptional 15.4% |
| Mongolians | 90.2 /100 | #130 | Exceptional 15.4% |
| Immigrants | Western Europe | 90.0 /100 | #131 | Exceptional 15.4% |
| Immigrants | Kazakhstan | 88.7 /100 | #132 | Excellent 15.5% |
| Welsh | 88.3 /100 | #133 | Excellent 15.5% |
| Peruvians | 88.1 /100 | #134 | Excellent 15.5% |
| Portuguese | 87.5 /100 | #135 | Excellent 15.5% |
| Icelanders | 87.5 /100 | #136 | Excellent 15.5% |
| Immigrants | Spain | 87.1 /100 | #137 | Excellent 15.6% |
Demographics Similar to Immigrants from Canada by Child Poverty Among Boys Under 16
In terms of child poverty among boys under 16, the demographic groups most similar to Immigrants from Canada are Ukrainian (14.7%, a difference of 0.020%), Immigrants from Russia (14.7%, a difference of 0.14%), Immigrants from Eastern Europe (14.7%, a difference of 0.22%), Immigrants from South Africa (14.8%, a difference of 0.26%), and Egyptian (14.7%, a difference of 0.33%).
| Demographics | Rating | Rank | Child Poverty Among Boys Under 16 |
| Australians | 98.0 /100 | #74 | Exceptional 14.7% |
| Immigrants | Poland | 97.9 /100 | #75 | Exceptional 14.7% |
| Immigrants | Croatia | 97.9 /100 | #76 | Exceptional 14.7% |
| Macedonians | 97.9 /100 | #77 | Exceptional 14.7% |
| Egyptians | 97.8 /100 | #78 | Exceptional 14.7% |
| Immigrants | Eastern Europe | 97.8 /100 | #79 | Exceptional 14.7% |
| Immigrants | Russia | 97.7 /100 | #80 | Exceptional 14.7% |
| Immigrants | Canada | 97.6 /100 | #81 | Exceptional 14.7% |
| Ukrainians | 97.6 /100 | #82 | Exceptional 14.7% |
| Immigrants | South Africa | 97.4 /100 | #83 | Exceptional 14.8% |
| Swiss | 97.3 /100 | #84 | Exceptional 14.8% |
| Taiwanese | 97.3 /100 | #85 | Exceptional 14.8% |
| Germans | 97.2 /100 | #86 | Exceptional 14.8% |
| Northern Europeans | 97.2 /100 | #87 | Exceptional 14.8% |
| Immigrants | North America | 97.1 /100 | #88 | Exceptional 14.8% |