Croatian vs Immigrants from Canada Divorced or Separated
COMPARE
Croatian
Immigrants from Canada
Divorced or Separated
Divorced or Separated Comparison
Croatians
Immigrants from Canada
11.9%
DIVORCED OR SEPARATED
80.6/ 100
METRIC RATING
145th/ 347
METRIC RANK
12.1%
DIVORCED OR SEPARATED
44.0/ 100
METRIC RATING
181st/ 347
METRIC RANK
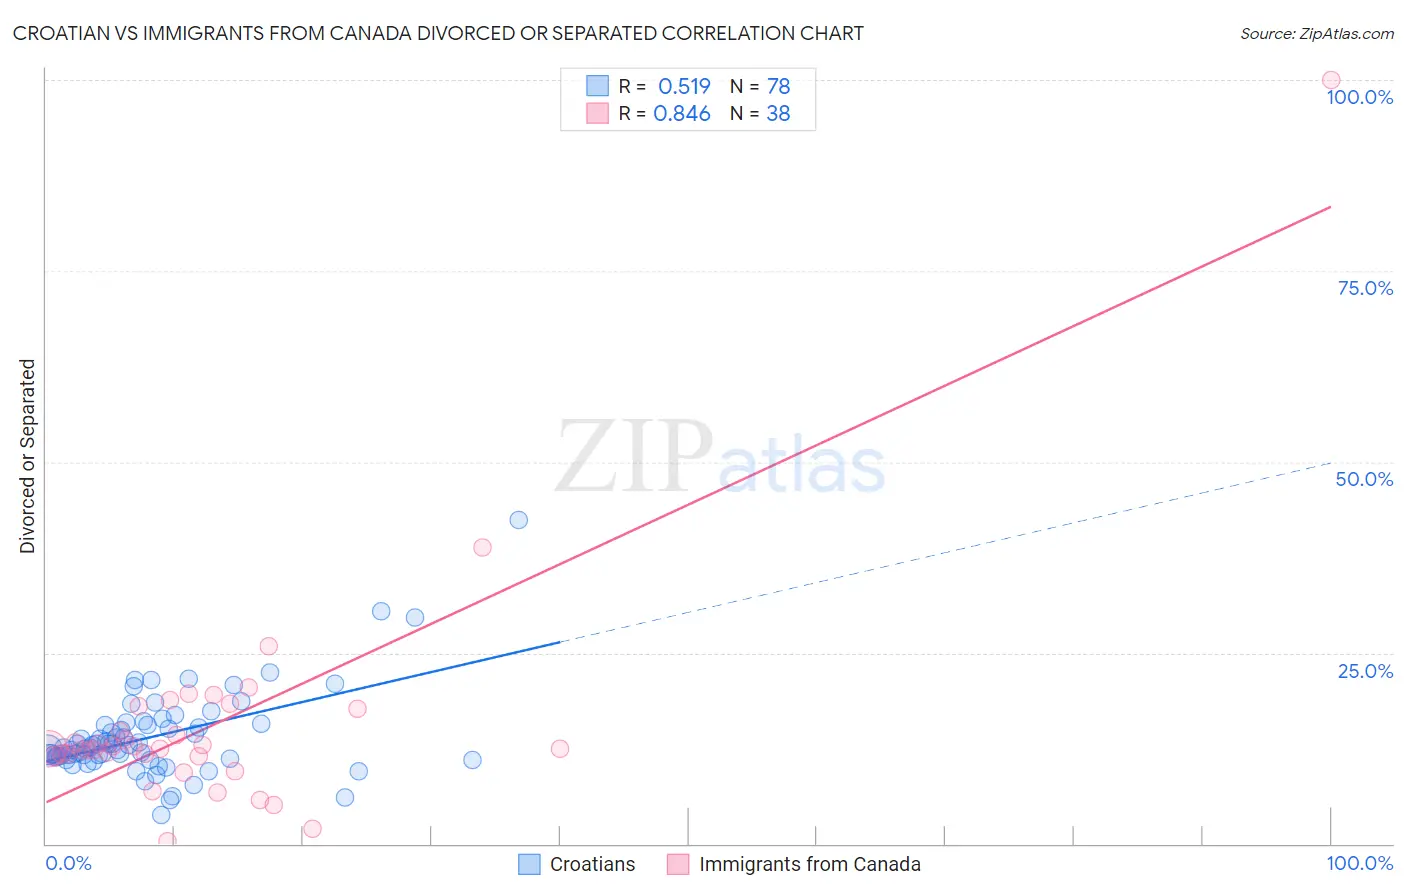
Croatian vs Immigrants from Canada Divorced or Separated Correlation Chart
The statistical analysis conducted on geographies consisting of 375,586,631 people shows a substantial positive correlation between the proportion of Croatians and percentage of population currently divorced or separated in the United States with a correlation coefficient (R) of 0.519 and weighted average of 11.9%. Similarly, the statistical analysis conducted on geographies consisting of 459,212,003 people shows a very strong positive correlation between the proportion of Immigrants from Canada and percentage of population currently divorced or separated in the United States with a correlation coefficient (R) of 0.846 and weighted average of 12.1%, a difference of 1.5%.
Divorced or Separated Correlation Summary
| Measurement | Croatian | Immigrants from Canada |
| Minimum | 3.7% | 0.33% |
| Maximum | 42.4% | 100.0% |
| Range | 38.7% | 99.7% |
| Mean | 14.0% | 15.6% |
| Median | 12.6% | 12.5% |
| Interquartile 25% (IQ1) | 11.4% | 11.5% |
| Interquartile 75% (IQ3) | 15.6% | 17.6% |
| Interquartile Range (IQR) | 4.2% | 6.1% |
| Standard Deviation (Sample) | 5.7% | 15.5% |
| Standard Deviation (Population) | 5.6% | 15.3% |
Similar Demographics by Divorced or Separated
Demographics Similar to Croatians by Divorced or Separated
In terms of divorced or separated, the demographic groups most similar to Croatians are Peruvian (11.9%, a difference of 0.020%), Immigrants from Zimbabwe (11.9%, a difference of 0.050%), Pakistani (11.9%, a difference of 0.050%), Immigrants from Grenada (11.9%, a difference of 0.080%), and Polish (11.9%, a difference of 0.11%).
| Demographics | Rating | Rank | Divorced or Separated |
| Immigrants | Netherlands | 83.9 /100 | #138 | Excellent 11.9% |
| Australians | 83.6 /100 | #139 | Excellent 11.9% |
| Lebanese | 83.4 /100 | #140 | Excellent 11.9% |
| Immigrants | Morocco | 82.9 /100 | #141 | Excellent 11.9% |
| Immigrants | Zimbabwe | 81.5 /100 | #142 | Excellent 11.9% |
| Pakistanis | 81.3 /100 | #143 | Excellent 11.9% |
| Peruvians | 80.9 /100 | #144 | Excellent 11.9% |
| Croatians | 80.6 /100 | #145 | Excellent 11.9% |
| Immigrants | Grenada | 79.1 /100 | #146 | Good 11.9% |
| Poles | 78.6 /100 | #147 | Good 11.9% |
| Italians | 77.8 /100 | #148 | Good 11.9% |
| Immigrants | Oceania | 77.7 /100 | #149 | Good 11.9% |
| Immigrants | Portugal | 77.3 /100 | #150 | Good 11.9% |
| Czechs | 76.4 /100 | #151 | Good 11.9% |
| Immigrants | Hungary | 73.7 /100 | #152 | Good 11.9% |
Demographics Similar to Immigrants from Canada by Divorced or Separated
In terms of divorced or separated, the demographic groups most similar to Immigrants from Canada are Barbadian (12.1%, a difference of 0.030%), Immigrants from Ethiopia (12.1%, a difference of 0.030%), Immigrants from Central America (12.1%, a difference of 0.040%), Immigrants from Western Europe (12.1%, a difference of 0.050%), and Ghanaian (12.1%, a difference of 0.060%).
| Demographics | Rating | Rank | Divorced or Separated |
| Hawaiians | 50.0 /100 | #174 | Average 12.1% |
| Immigrants | Sierra Leone | 50.0 /100 | #175 | Average 12.1% |
| Pennsylvania Germans | 48.9 /100 | #176 | Average 12.1% |
| Brazilians | 47.7 /100 | #177 | Average 12.1% |
| Ghanaians | 45.9 /100 | #178 | Average 12.1% |
| Immigrants | Western Europe | 45.6 /100 | #179 | Average 12.1% |
| Barbadians | 45.0 /100 | #180 | Average 12.1% |
| Immigrants | Canada | 44.0 /100 | #181 | Average 12.1% |
| Immigrants | Ethiopia | 43.1 /100 | #182 | Average 12.1% |
| Immigrants | Central America | 42.9 /100 | #183 | Average 12.1% |
| Immigrants | North America | 41.1 /100 | #184 | Average 12.1% |
| Immigrants | Nigeria | 40.5 /100 | #185 | Average 12.1% |
| Immigrants | Chile | 39.0 /100 | #186 | Fair 12.1% |
| Belizeans | 37.7 /100 | #187 | Fair 12.1% |
| Immigrants | Belize | 37.6 /100 | #188 | Fair 12.1% |