Mongolian vs Immigrants from Latvia Divorced or Separated
COMPARE
Mongolian
Immigrants from Latvia
Divorced or Separated
Divorced or Separated Comparison
Mongolians
Immigrants from Latvia
11.1%
DIVORCED OR SEPARATED
100.0/ 100
METRIC RATING
31st/ 347
METRIC RANK
11.6%
DIVORCED OR SEPARATED
99.2/ 100
METRIC RATING
86th/ 347
METRIC RANK
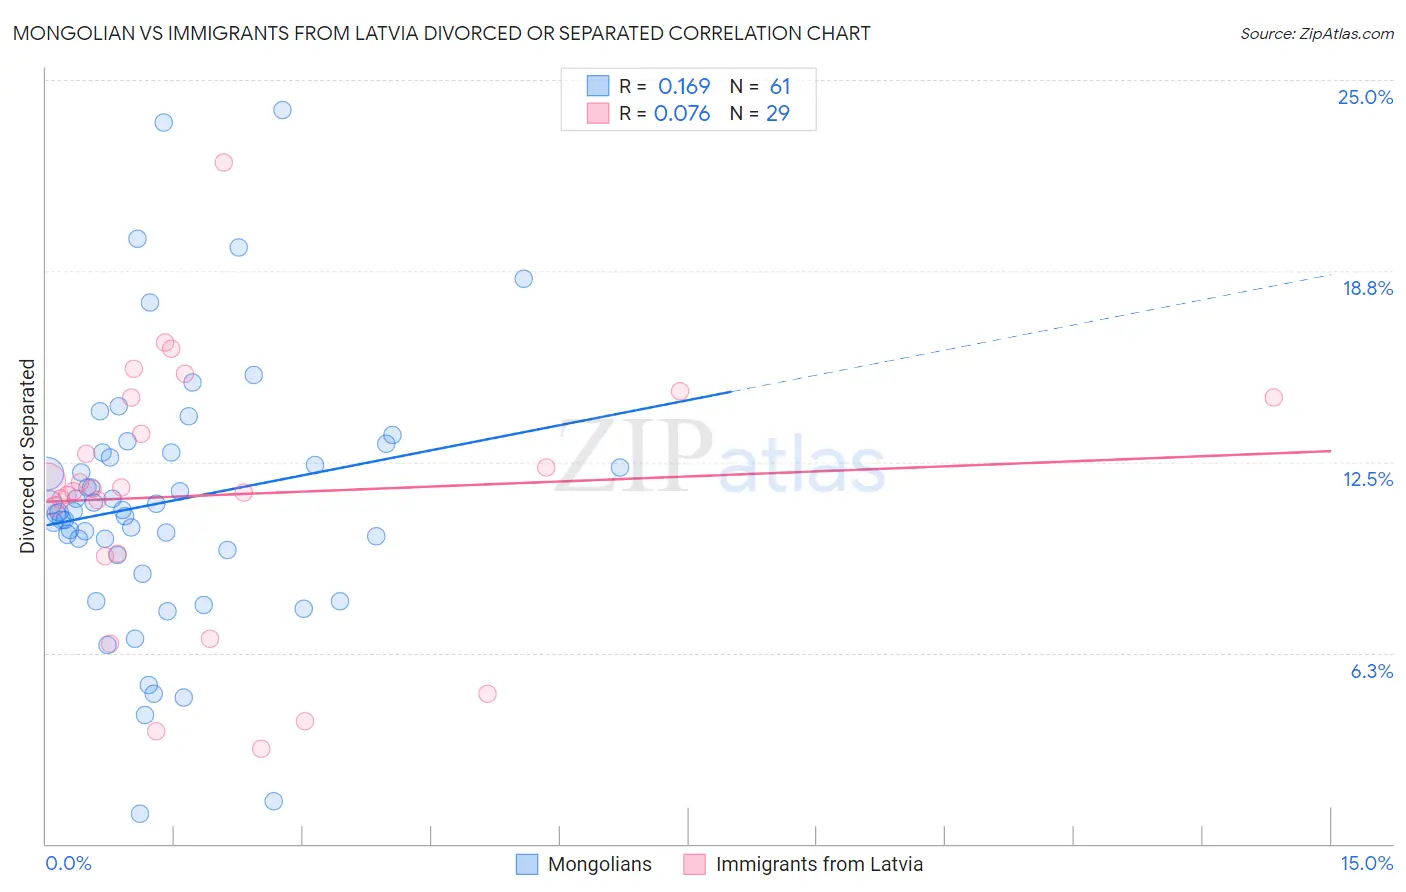
Mongolian vs Immigrants from Latvia Divorced or Separated Correlation Chart
The statistical analysis conducted on geographies consisting of 140,326,151 people shows a poor positive correlation between the proportion of Mongolians and percentage of population currently divorced or separated in the United States with a correlation coefficient (R) of 0.169 and weighted average of 11.1%. Similarly, the statistical analysis conducted on geographies consisting of 113,726,313 people shows a slight positive correlation between the proportion of Immigrants from Latvia and percentage of population currently divorced or separated in the United States with a correlation coefficient (R) of 0.076 and weighted average of 11.6%, a difference of 4.4%.
Divorced or Separated Correlation Summary
| Measurement | Mongolian | Immigrants from Latvia |
| Minimum | 1.0% | 3.1% |
| Maximum | 24.0% | 22.3% |
| Range | 23.0% | 19.2% |
| Mean | 11.2% | 11.4% |
| Median | 10.9% | 11.6% |
| Interquartile 25% (IQ1) | 9.5% | 9.5% |
| Interquartile 75% (IQ3) | 12.8% | 14.6% |
| Interquartile Range (IQR) | 3.3% | 5.1% |
| Standard Deviation (Sample) | 4.3% | 4.3% |
| Standard Deviation (Population) | 4.3% | 4.2% |
Similar Demographics by Divorced or Separated
Demographics Similar to Mongolians by Divorced or Separated
In terms of divorced or separated, the demographic groups most similar to Mongolians are Tongan (11.1%, a difference of 0.080%), Egyptian (11.1%, a difference of 0.12%), Immigrants from Uzbekistan (11.1%, a difference of 0.19%), Cambodian (11.1%, a difference of 0.27%), and Immigrants from Ireland (11.0%, a difference of 0.30%).
| Demographics | Rating | Rank | Divorced or Separated |
| Immigrants | Sri Lanka | 100.0 /100 | #24 | Exceptional 10.8% |
| Iranians | 100.0 /100 | #25 | Exceptional 10.8% |
| Immigrants | Indonesia | 100.0 /100 | #26 | Exceptional 10.9% |
| Immigrants | Bangladesh | 100.0 /100 | #27 | Exceptional 11.0% |
| Immigrants | Malaysia | 100.0 /100 | #28 | Exceptional 11.0% |
| Armenians | 100.0 /100 | #29 | Exceptional 11.0% |
| Immigrants | Ireland | 100.0 /100 | #30 | Exceptional 11.0% |
| Mongolians | 100.0 /100 | #31 | Exceptional 11.1% |
| Tongans | 100.0 /100 | #32 | Exceptional 11.1% |
| Egyptians | 100.0 /100 | #33 | Exceptional 11.1% |
| Immigrants | Uzbekistan | 100.0 /100 | #34 | Exceptional 11.1% |
| Cambodians | 100.0 /100 | #35 | Exceptional 11.1% |
| Immigrants | Japan | 100.0 /100 | #36 | Exceptional 11.1% |
| Immigrants | Lebanon | 100.0 /100 | #37 | Exceptional 11.1% |
| Immigrants | Greece | 100.0 /100 | #38 | Exceptional 11.1% |
Demographics Similar to Immigrants from Latvia by Divorced or Separated
In terms of divorced or separated, the demographic groups most similar to Immigrants from Latvia are Immigrants from Nepal (11.6%, a difference of 0.030%), Immigrants from Europe (11.6%, a difference of 0.050%), Immigrants from Albania (11.5%, a difference of 0.070%), Immigrants from Southern Europe (11.6%, a difference of 0.090%), and Bulgarian (11.5%, a difference of 0.13%).
| Demographics | Rating | Rank | Divorced or Separated |
| Guyanese | 99.4 /100 | #79 | Exceptional 11.5% |
| Immigrants | Switzerland | 99.4 /100 | #80 | Exceptional 11.5% |
| Russians | 99.4 /100 | #81 | Exceptional 11.5% |
| Immigrants | Romania | 99.3 /100 | #82 | Exceptional 11.5% |
| Immigrants | Bulgaria | 99.3 /100 | #83 | Exceptional 11.5% |
| Bulgarians | 99.3 /100 | #84 | Exceptional 11.5% |
| Immigrants | Albania | 99.3 /100 | #85 | Exceptional 11.5% |
| Immigrants | Latvia | 99.2 /100 | #86 | Exceptional 11.6% |
| Immigrants | Nepal | 99.2 /100 | #87 | Exceptional 11.6% |
| Immigrants | Europe | 99.2 /100 | #88 | Exceptional 11.6% |
| Immigrants | Southern Europe | 99.1 /100 | #89 | Exceptional 11.6% |
| Zimbabweans | 99.0 /100 | #90 | Exceptional 11.6% |
| Spanish American Indians | 99.0 /100 | #91 | Exceptional 11.6% |
| Immigrants | Denmark | 98.9 /100 | #92 | Exceptional 11.6% |
| Arabs | 98.9 /100 | #93 | Exceptional 11.6% |