South American vs Immigrants from Canada Divorced or Separated
COMPARE
South American
Immigrants from Canada
Divorced or Separated
Divorced or Separated Comparison
South Americans
Immigrants from Canada
12.2%
DIVORCED OR SEPARATED
28.6/ 100
METRIC RATING
200th/ 347
METRIC RANK
12.1%
DIVORCED OR SEPARATED
44.0/ 100
METRIC RATING
181st/ 347
METRIC RANK
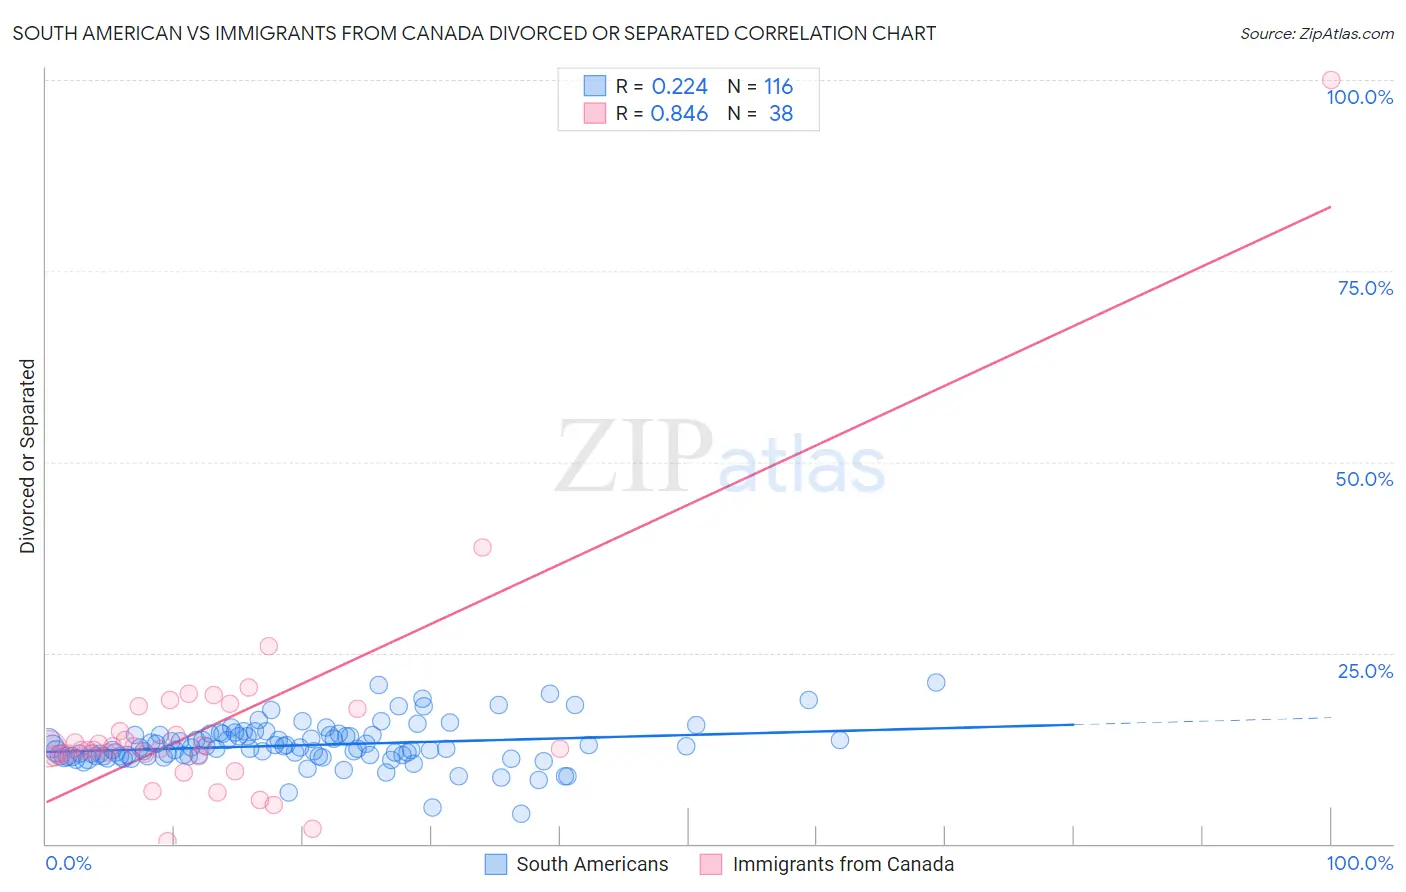
South American vs Immigrants from Canada Divorced or Separated Correlation Chart
The statistical analysis conducted on geographies consisting of 493,837,840 people shows a weak positive correlation between the proportion of South Americans and percentage of population currently divorced or separated in the United States with a correlation coefficient (R) of 0.224 and weighted average of 12.2%. Similarly, the statistical analysis conducted on geographies consisting of 459,212,003 people shows a very strong positive correlation between the proportion of Immigrants from Canada and percentage of population currently divorced or separated in the United States with a correlation coefficient (R) of 0.846 and weighted average of 12.1%, a difference of 0.58%.
Divorced or Separated Correlation Summary
| Measurement | South American | Immigrants from Canada |
| Minimum | 4.0% | 0.33% |
| Maximum | 21.1% | 100.0% |
| Range | 17.1% | 99.7% |
| Mean | 12.9% | 15.6% |
| Median | 12.5% | 12.5% |
| Interquartile 25% (IQ1) | 11.4% | 11.5% |
| Interquartile 75% (IQ3) | 14.2% | 17.6% |
| Interquartile Range (IQR) | 2.7% | 6.1% |
| Standard Deviation (Sample) | 2.8% | 15.5% |
| Standard Deviation (Population) | 2.7% | 15.3% |
Demographics Similar to South Americans and Immigrants from Canada by Divorced or Separated
In terms of divorced or separated, the demographic groups most similar to South Americans are Central American (12.1%, a difference of 0.030%), Nigerian (12.1%, a difference of 0.060%), Immigrants from Burma/Myanmar (12.1%, a difference of 0.070%), Immigrants from Africa (12.1%, a difference of 0.070%), and Immigrants from England (12.1%, a difference of 0.12%). Similarly, the demographic groups most similar to Immigrants from Canada are Barbadian (12.1%, a difference of 0.030%), Immigrants from Ethiopia (12.1%, a difference of 0.030%), Immigrants from Central America (12.1%, a difference of 0.040%), Immigrants from North America (12.1%, a difference of 0.10%), and Immigrants from Nigeria (12.1%, a difference of 0.12%).
| Demographics | Rating | Rank | Divorced or Separated |
| Barbadians | 45.0 /100 | #180 | Average 12.1% |
| Immigrants | Canada | 44.0 /100 | #181 | Average 12.1% |
| Immigrants | Ethiopia | 43.1 /100 | #182 | Average 12.1% |
| Immigrants | Central America | 42.9 /100 | #183 | Average 12.1% |
| Immigrants | North America | 41.1 /100 | #184 | Average 12.1% |
| Immigrants | Nigeria | 40.5 /100 | #185 | Average 12.1% |
| Immigrants | Chile | 39.0 /100 | #186 | Fair 12.1% |
| Belizeans | 37.7 /100 | #187 | Fair 12.1% |
| Immigrants | Belize | 37.6 /100 | #188 | Fair 12.1% |
| Sierra Leoneans | 35.5 /100 | #189 | Fair 12.1% |
| Moroccans | 34.8 /100 | #190 | Fair 12.1% |
| Swedes | 34.4 /100 | #191 | Fair 12.1% |
| Norwegians | 33.2 /100 | #192 | Fair 12.1% |
| Immigrants | Thailand | 32.5 /100 | #193 | Fair 12.1% |
| Immigrants | Eritrea | 31.9 /100 | #194 | Fair 12.1% |
| Immigrants | England | 31.4 /100 | #195 | Fair 12.1% |
| Immigrants | Burma/Myanmar | 30.4 /100 | #196 | Fair 12.1% |
| Immigrants | Africa | 30.3 /100 | #197 | Fair 12.1% |
| Nigerians | 30.1 /100 | #198 | Fair 12.1% |
| Central Americans | 29.4 /100 | #199 | Fair 12.1% |
| South Americans | 28.6 /100 | #200 | Fair 12.2% |