Slavic vs Comanche Currently Married
COMPARE
Slavic
Comanche
Currently Married
Currently Married Comparison
Slavs
Comanche
48.4%
CURRENTLY MARRIED
98.3/ 100
METRIC RATING
63rd/ 347
METRIC RANK
45.0%
CURRENTLY MARRIED
2.1/ 100
METRIC RATING
226th/ 347
METRIC RANK
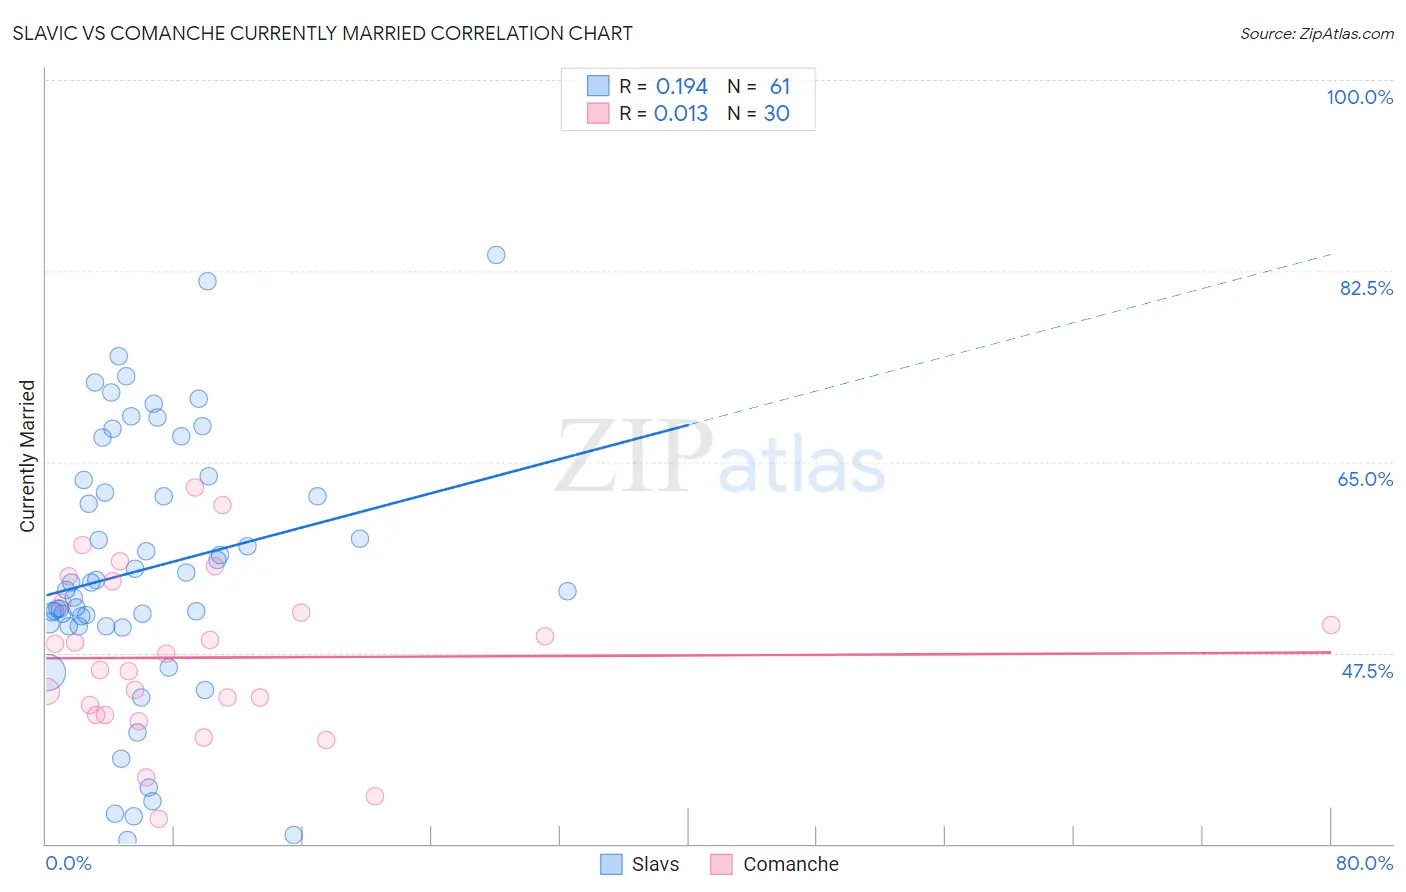
Slavic vs Comanche Currently Married Correlation Chart
The statistical analysis conducted on geographies consisting of 270,868,948 people shows a poor positive correlation between the proportion of Slavs and percentage of population currently married in the United States with a correlation coefficient (R) of 0.194 and weighted average of 48.4%. Similarly, the statistical analysis conducted on geographies consisting of 109,782,091 people shows no correlation between the proportion of Comanche and percentage of population currently married in the United States with a correlation coefficient (R) of 0.013 and weighted average of 45.0%, a difference of 7.5%.
Currently Married Correlation Summary
| Measurement | Slavic | Comanche |
| Minimum | 30.3% | 32.3% |
| Maximum | 84.0% | 62.7% |
| Range | 53.7% | 30.4% |
| Mean | 55.2% | 47.1% |
| Median | 53.9% | 46.6% |
| Interquartile 25% (IQ1) | 50.0% | 41.8% |
| Interquartile 75% (IQ3) | 63.5% | 52.1% |
| Interquartile Range (IQR) | 13.6% | 10.2% |
| Standard Deviation (Sample) | 12.2% | 7.5% |
| Standard Deviation (Population) | 12.1% | 7.4% |
Similar Demographics by Currently Married
Demographics Similar to Slavs by Currently Married
In terms of currently married, the demographic groups most similar to Slavs are Immigrants from Czechoslovakia (48.4%, a difference of 0.0%), Ukrainian (48.4%, a difference of 0.010%), Tongan (48.3%, a difference of 0.040%), Slovak (48.3%, a difference of 0.050%), and Immigrants from England (48.3%, a difference of 0.060%).
| Demographics | Rating | Rank | Currently Married |
| Latvians | 98.7 /100 | #56 | Exceptional 48.5% |
| Immigrants | Netherlands | 98.6 /100 | #57 | Exceptional 48.5% |
| French | 98.6 /100 | #58 | Exceptional 48.4% |
| Immigrants | Ireland | 98.5 /100 | #59 | Exceptional 48.4% |
| Immigrants | Romania | 98.5 /100 | #60 | Exceptional 48.4% |
| Romanians | 98.5 /100 | #61 | Exceptional 48.4% |
| Asians | 98.5 /100 | #62 | Exceptional 48.4% |
| Slavs | 98.3 /100 | #63 | Exceptional 48.4% |
| Immigrants | Czechoslovakia | 98.3 /100 | #64 | Exceptional 48.4% |
| Ukrainians | 98.3 /100 | #65 | Exceptional 48.4% |
| Tongans | 98.2 /100 | #66 | Exceptional 48.3% |
| Slovaks | 98.2 /100 | #67 | Exceptional 48.3% |
| Immigrants | England | 98.2 /100 | #68 | Exceptional 48.3% |
| Canadians | 98.1 /100 | #69 | Exceptional 48.3% |
| Immigrants | Asia | 97.9 /100 | #70 | Exceptional 48.3% |
Demographics Similar to Comanche by Currently Married
In terms of currently married, the demographic groups most similar to Comanche are Spanish American (45.0%, a difference of 0.0%), Immigrants from Uruguay (45.0%, a difference of 0.010%), Immigrants from Uganda (45.0%, a difference of 0.050%), French American Indian (45.0%, a difference of 0.050%), and Immigrants from Laos (45.0%, a difference of 0.10%).
| Demographics | Rating | Rank | Currently Married |
| Immigrants | Portugal | 3.5 /100 | #219 | Tragic 45.2% |
| Kenyans | 3.1 /100 | #220 | Tragic 45.2% |
| Mexicans | 3.0 /100 | #221 | Tragic 45.2% |
| Immigrants | Azores | 2.5 /100 | #222 | Tragic 45.1% |
| Immigrants | Laos | 2.3 /100 | #223 | Tragic 45.0% |
| Immigrants | Uganda | 2.2 /100 | #224 | Tragic 45.0% |
| French American Indians | 2.2 /100 | #225 | Tragic 45.0% |
| Comanche | 2.1 /100 | #226 | Tragic 45.0% |
| Spanish Americans | 2.1 /100 | #227 | Tragic 45.0% |
| Immigrants | Uruguay | 2.0 /100 | #228 | Tragic 45.0% |
| Cree | 1.7 /100 | #229 | Tragic 44.9% |
| Immigrants | Kenya | 1.6 /100 | #230 | Tragic 44.9% |
| Immigrants | Panama | 1.5 /100 | #231 | Tragic 44.9% |
| Nepalese | 1.2 /100 | #232 | Tragic 44.7% |
| Immigrants | Saudi Arabia | 1.1 /100 | #233 | Tragic 44.7% |