Mongolian vs Immigrants from Nicaragua Currently Married
COMPARE
Mongolian
Immigrants from Nicaragua
Currently Married
Currently Married Comparison
Mongolians
Immigrants from Nicaragua
46.4%
CURRENTLY MARRIED
37.6/ 100
METRIC RATING
185th/ 347
METRIC RANK
43.7%
CURRENTLY MARRIED
0.1/ 100
METRIC RATING
261st/ 347
METRIC RANK
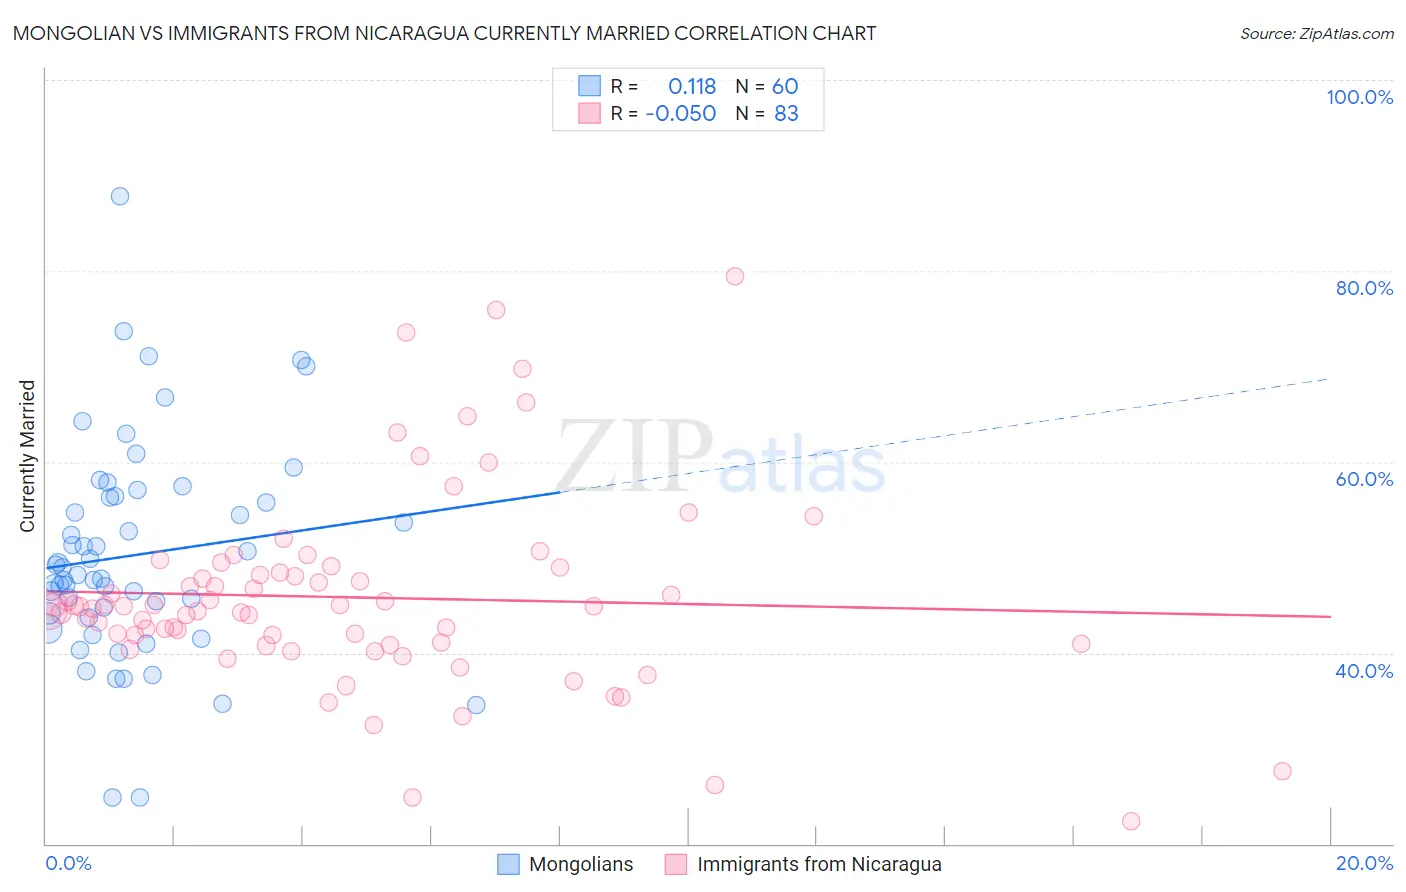
Mongolian vs Immigrants from Nicaragua Currently Married Correlation Chart
The statistical analysis conducted on geographies consisting of 140,349,335 people shows a poor positive correlation between the proportion of Mongolians and percentage of population currently married in the United States with a correlation coefficient (R) of 0.118 and weighted average of 46.4%. Similarly, the statistical analysis conducted on geographies consisting of 236,341,700 people shows a slight negative correlation between the proportion of Immigrants from Nicaragua and percentage of population currently married in the United States with a correlation coefficient (R) of -0.050 and weighted average of 43.7%, a difference of 6.1%.
Currently Married Correlation Summary
| Measurement | Mongolian | Immigrants from Nicaragua |
| Minimum | 24.8% | 22.3% |
| Maximum | 87.8% | 79.4% |
| Range | 63.0% | 57.1% |
| Mean | 50.2% | 45.8% |
| Median | 48.6% | 44.9% |
| Interquartile 25% (IQ1) | 43.9% | 40.9% |
| Interquartile 75% (IQ3) | 56.3% | 48.4% |
| Interquartile Range (IQR) | 12.4% | 7.5% |
| Standard Deviation (Sample) | 11.3% | 10.1% |
| Standard Deviation (Population) | 11.3% | 10.1% |
Similar Demographics by Currently Married
Demographics Similar to Mongolians by Currently Married
In terms of currently married, the demographic groups most similar to Mongolians are Immigrants from Chile (46.4%, a difference of 0.030%), Brazilian (46.4%, a difference of 0.070%), Immigrants from Northern Africa (46.5%, a difference of 0.080%), Immigrants from Peru (46.4%, a difference of 0.090%), and Potawatomi (46.5%, a difference of 0.16%).
| Demographics | Rating | Rank | Currently Married |
| Chickasaw | 47.8 /100 | #178 | Average 46.6% |
| Immigrants | Oceania | 44.6 /100 | #179 | Average 46.5% |
| Costa Ricans | 43.7 /100 | #180 | Average 46.5% |
| Ottawa | 43.0 /100 | #181 | Average 46.5% |
| Potawatomi | 41.9 /100 | #182 | Average 46.5% |
| Immigrants | Northern Africa | 39.7 /100 | #183 | Fair 46.5% |
| Brazilians | 39.3 /100 | #184 | Fair 46.4% |
| Mongolians | 37.6 /100 | #185 | Fair 46.4% |
| Immigrants | Chile | 36.8 /100 | #186 | Fair 46.4% |
| Immigrants | Peru | 35.3 /100 | #187 | Fair 46.4% |
| Colombians | 31.8 /100 | #188 | Fair 46.3% |
| Fijians | 30.3 /100 | #189 | Fair 46.3% |
| Choctaw | 29.1 /100 | #190 | Fair 46.3% |
| Immigrants | France | 27.7 /100 | #191 | Fair 46.2% |
| Soviet Union | 25.7 /100 | #192 | Fair 46.2% |
Demographics Similar to Immigrants from Nicaragua by Currently Married
In terms of currently married, the demographic groups most similar to Immigrants from Nicaragua are Immigrants from Latin America (43.8%, a difference of 0.040%), Immigrants from Sierra Leone (43.8%, a difference of 0.11%), Bangladeshi (43.7%, a difference of 0.14%), Immigrants from Cuba (43.7%, a difference of 0.18%), and Sudanese (43.7%, a difference of 0.19%).
| Demographics | Rating | Rank | Currently Married |
| Vietnamese | 0.2 /100 | #254 | Tragic 44.0% |
| Yakama | 0.2 /100 | #255 | Tragic 44.0% |
| Shoshone | 0.2 /100 | #256 | Tragic 44.0% |
| Immigrants | Africa | 0.2 /100 | #257 | Tragic 43.9% |
| Ute | 0.2 /100 | #258 | Tragic 43.9% |
| Immigrants | Sierra Leone | 0.1 /100 | #259 | Tragic 43.8% |
| Immigrants | Latin America | 0.1 /100 | #260 | Tragic 43.8% |
| Immigrants | Nicaragua | 0.1 /100 | #261 | Tragic 43.7% |
| Bangladeshis | 0.1 /100 | #262 | Tragic 43.7% |
| Immigrants | Cuba | 0.1 /100 | #263 | Tragic 43.7% |
| Sudanese | 0.1 /100 | #264 | Tragic 43.7% |
| Immigrants | Bangladesh | 0.1 /100 | #265 | Tragic 43.6% |
| Ecuadorians | 0.1 /100 | #266 | Tragic 43.6% |
| Immigrants | Eritrea | 0.1 /100 | #267 | Tragic 43.6% |
| Spanish American Indians | 0.1 /100 | #268 | Tragic 43.6% |