Mongolian vs Liberian Currently Married
COMPARE
Mongolian
Liberian
Currently Married
Currently Married Comparison
Mongolians
Liberians
46.4%
CURRENTLY MARRIED
37.6/ 100
METRIC RATING
185th/ 347
METRIC RANK
42.2%
CURRENTLY MARRIED
0.0/ 100
METRIC RATING
299th/ 347
METRIC RANK
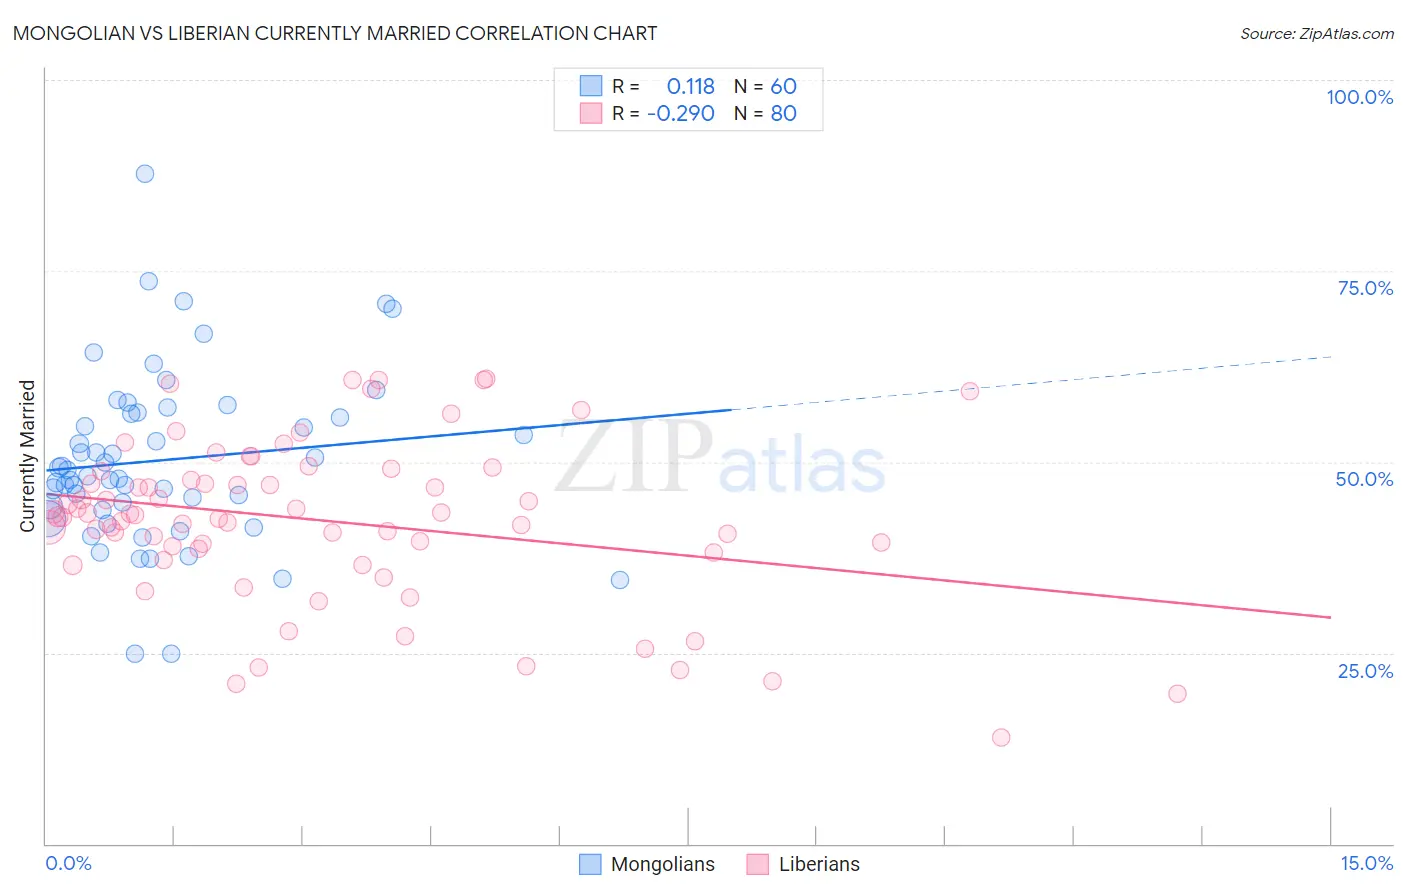
Mongolian vs Liberian Currently Married Correlation Chart
The statistical analysis conducted on geographies consisting of 140,349,335 people shows a poor positive correlation between the proportion of Mongolians and percentage of population currently married in the United States with a correlation coefficient (R) of 0.118 and weighted average of 46.4%. Similarly, the statistical analysis conducted on geographies consisting of 118,089,521 people shows a weak negative correlation between the proportion of Liberians and percentage of population currently married in the United States with a correlation coefficient (R) of -0.290 and weighted average of 42.2%, a difference of 10.0%.
Currently Married Correlation Summary
| Measurement | Mongolian | Liberian |
| Minimum | 24.8% | 13.9% |
| Maximum | 87.8% | 60.9% |
| Range | 63.0% | 47.0% |
| Mean | 50.2% | 42.3% |
| Median | 48.6% | 42.9% |
| Interquartile 25% (IQ1) | 43.9% | 38.4% |
| Interquartile 75% (IQ3) | 56.3% | 48.1% |
| Interquartile Range (IQR) | 12.4% | 9.7% |
| Standard Deviation (Sample) | 11.3% | 10.5% |
| Standard Deviation (Population) | 11.3% | 10.4% |
Similar Demographics by Currently Married
Demographics Similar to Mongolians by Currently Married
In terms of currently married, the demographic groups most similar to Mongolians are Immigrants from Chile (46.4%, a difference of 0.030%), Brazilian (46.4%, a difference of 0.070%), Immigrants from Northern Africa (46.5%, a difference of 0.080%), Immigrants from Peru (46.4%, a difference of 0.090%), and Potawatomi (46.5%, a difference of 0.16%).
| Demographics | Rating | Rank | Currently Married |
| Chickasaw | 47.8 /100 | #178 | Average 46.6% |
| Immigrants | Oceania | 44.6 /100 | #179 | Average 46.5% |
| Costa Ricans | 43.7 /100 | #180 | Average 46.5% |
| Ottawa | 43.0 /100 | #181 | Average 46.5% |
| Potawatomi | 41.9 /100 | #182 | Average 46.5% |
| Immigrants | Northern Africa | 39.7 /100 | #183 | Fair 46.5% |
| Brazilians | 39.3 /100 | #184 | Fair 46.4% |
| Mongolians | 37.6 /100 | #185 | Fair 46.4% |
| Immigrants | Chile | 36.8 /100 | #186 | Fair 46.4% |
| Immigrants | Peru | 35.3 /100 | #187 | Fair 46.4% |
| Colombians | 31.8 /100 | #188 | Fair 46.3% |
| Fijians | 30.3 /100 | #189 | Fair 46.3% |
| Choctaw | 29.1 /100 | #190 | Fair 46.3% |
| Immigrants | France | 27.7 /100 | #191 | Fair 46.2% |
| Soviet Union | 25.7 /100 | #192 | Fair 46.2% |
Demographics Similar to Liberians by Currently Married
In terms of currently married, the demographic groups most similar to Liberians are Immigrants from Honduras (42.2%, a difference of 0.030%), Belizean (42.2%, a difference of 0.10%), Cheyenne (42.2%, a difference of 0.12%), Menominee (42.3%, a difference of 0.23%), and Immigrants from Yemen (42.1%, a difference of 0.34%).
| Demographics | Rating | Rank | Currently Married |
| Sub-Saharan Africans | 0.0 /100 | #292 | Tragic 42.6% |
| Yuman | 0.0 /100 | #293 | Tragic 42.6% |
| Hondurans | 0.0 /100 | #294 | Tragic 42.5% |
| Immigrants | Western Africa | 0.0 /100 | #295 | Tragic 42.4% |
| Menominee | 0.0 /100 | #296 | Tragic 42.3% |
| Cheyenne | 0.0 /100 | #297 | Tragic 42.2% |
| Immigrants | Honduras | 0.0 /100 | #298 | Tragic 42.2% |
| Liberians | 0.0 /100 | #299 | Tragic 42.2% |
| Belizeans | 0.0 /100 | #300 | Tragic 42.2% |
| Immigrants | Yemen | 0.0 /100 | #301 | Tragic 42.1% |
| Immigrants | Zaire | 0.0 /100 | #302 | Tragic 42.0% |
| Sioux | 0.0 /100 | #303 | Tragic 41.9% |
| Immigrants | Bahamas | 0.0 /100 | #304 | Tragic 41.9% |
| Immigrants | Trinidad and Tobago | 0.0 /100 | #305 | Tragic 41.9% |
| Immigrants | Guyana | 0.0 /100 | #306 | Tragic 41.9% |