Scottish vs Comanche Currently Married
COMPARE
Scottish
Comanche
Currently Married
Currently Married Comparison
Scottish
Comanche
49.2%
CURRENTLY MARRIED
99.8/ 100
METRIC RATING
21st/ 347
METRIC RANK
45.0%
CURRENTLY MARRIED
2.1/ 100
METRIC RATING
226th/ 347
METRIC RANK
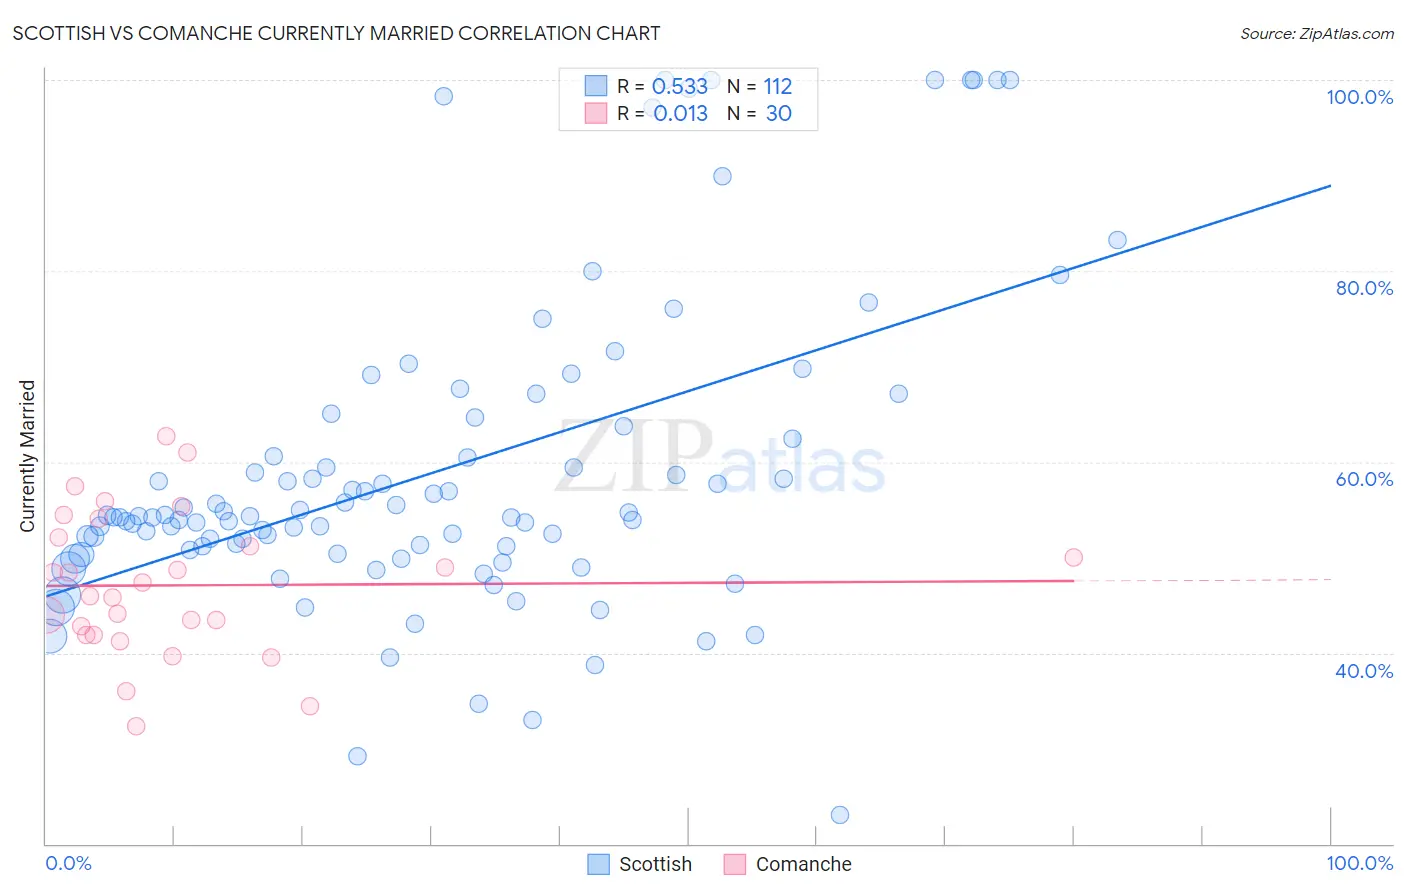
Scottish vs Comanche Currently Married Correlation Chart
The statistical analysis conducted on geographies consisting of 567,020,693 people shows a substantial positive correlation between the proportion of Scottish and percentage of population currently married in the United States with a correlation coefficient (R) of 0.533 and weighted average of 49.2%. Similarly, the statistical analysis conducted on geographies consisting of 109,782,091 people shows no correlation between the proportion of Comanche and percentage of population currently married in the United States with a correlation coefficient (R) of 0.013 and weighted average of 45.0%, a difference of 9.4%.
Currently Married Correlation Summary
| Measurement | Scottish | Comanche |
| Minimum | 23.0% | 32.3% |
| Maximum | 100.0% | 62.7% |
| Range | 77.0% | 30.4% |
| Mean | 59.0% | 47.1% |
| Median | 54.2% | 46.6% |
| Interquartile 25% (IQ1) | 51.0% | 41.8% |
| Interquartile 75% (IQ3) | 63.0% | 52.1% |
| Interquartile Range (IQR) | 12.1% | 10.2% |
| Standard Deviation (Sample) | 16.3% | 7.5% |
| Standard Deviation (Population) | 16.2% | 7.4% |
Similar Demographics by Currently Married
Demographics Similar to Scottish by Currently Married
In terms of currently married, the demographic groups most similar to Scottish are Luxembourger (49.3%, a difference of 0.11%), Bulgarian (49.1%, a difference of 0.22%), European (49.3%, a difference of 0.24%), Immigrants from Scotland (49.3%, a difference of 0.26%), and Immigrants from Pakistan (49.1%, a difference of 0.33%).
| Demographics | Rating | Rank | Currently Married |
| Germans | 99.9 /100 | #14 | Exceptional 49.6% |
| Pennsylvania Germans | 99.9 /100 | #15 | Exceptional 49.6% |
| Chinese | 99.9 /100 | #16 | Exceptional 49.5% |
| Scandinavians | 99.9 /100 | #17 | Exceptional 49.5% |
| Immigrants | Scotland | 99.8 /100 | #18 | Exceptional 49.3% |
| Europeans | 99.8 /100 | #19 | Exceptional 49.3% |
| Luxembourgers | 99.8 /100 | #20 | Exceptional 49.3% |
| Scottish | 99.8 /100 | #21 | Exceptional 49.2% |
| Bulgarians | 99.7 /100 | #22 | Exceptional 49.1% |
| Immigrants | Pakistan | 99.7 /100 | #23 | Exceptional 49.1% |
| Lithuanians | 99.6 /100 | #24 | Exceptional 49.0% |
| Maltese | 99.6 /100 | #25 | Exceptional 49.0% |
| Immigrants | Korea | 99.6 /100 | #26 | Exceptional 49.0% |
| Burmese | 99.6 /100 | #27 | Exceptional 48.9% |
| Welsh | 99.5 /100 | #28 | Exceptional 48.9% |
Demographics Similar to Comanche by Currently Married
In terms of currently married, the demographic groups most similar to Comanche are Spanish American (45.0%, a difference of 0.0%), Immigrants from Uruguay (45.0%, a difference of 0.010%), Immigrants from Uganda (45.0%, a difference of 0.050%), French American Indian (45.0%, a difference of 0.050%), and Immigrants from Laos (45.0%, a difference of 0.10%).
| Demographics | Rating | Rank | Currently Married |
| Immigrants | Portugal | 3.5 /100 | #219 | Tragic 45.2% |
| Kenyans | 3.1 /100 | #220 | Tragic 45.2% |
| Mexicans | 3.0 /100 | #221 | Tragic 45.2% |
| Immigrants | Azores | 2.5 /100 | #222 | Tragic 45.1% |
| Immigrants | Laos | 2.3 /100 | #223 | Tragic 45.0% |
| Immigrants | Uganda | 2.2 /100 | #224 | Tragic 45.0% |
| French American Indians | 2.2 /100 | #225 | Tragic 45.0% |
| Comanche | 2.1 /100 | #226 | Tragic 45.0% |
| Spanish Americans | 2.1 /100 | #227 | Tragic 45.0% |
| Immigrants | Uruguay | 2.0 /100 | #228 | Tragic 45.0% |
| Cree | 1.7 /100 | #229 | Tragic 44.9% |
| Immigrants | Kenya | 1.6 /100 | #230 | Tragic 44.9% |
| Immigrants | Panama | 1.5 /100 | #231 | Tragic 44.9% |
| Nepalese | 1.2 /100 | #232 | Tragic 44.7% |
| Immigrants | Saudi Arabia | 1.1 /100 | #233 | Tragic 44.7% |