Nicaraguan vs Comanche Currently Married
COMPARE
Nicaraguan
Comanche
Currently Married
Currently Married Comparison
Nicaraguans
Comanche
44.2%
CURRENTLY MARRIED
0.3/ 100
METRIC RATING
248th/ 347
METRIC RANK
45.0%
CURRENTLY MARRIED
2.1/ 100
METRIC RATING
226th/ 347
METRIC RANK
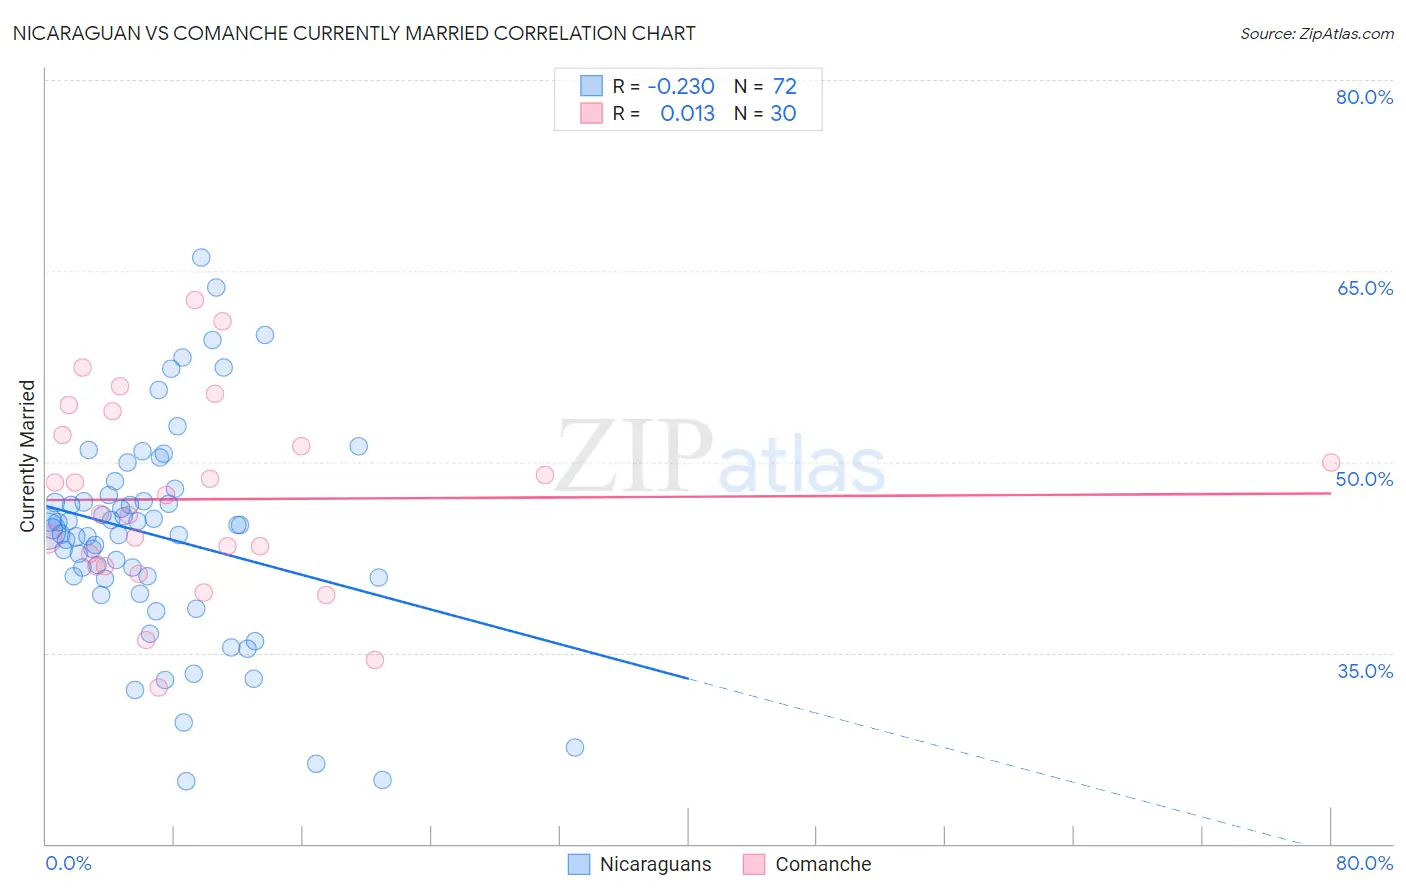
Nicaraguan vs Comanche Currently Married Correlation Chart
The statistical analysis conducted on geographies consisting of 285,678,728 people shows a weak negative correlation between the proportion of Nicaraguans and percentage of population currently married in the United States with a correlation coefficient (R) of -0.230 and weighted average of 44.2%. Similarly, the statistical analysis conducted on geographies consisting of 109,782,091 people shows no correlation between the proportion of Comanche and percentage of population currently married in the United States with a correlation coefficient (R) of 0.013 and weighted average of 45.0%, a difference of 1.8%.
Currently Married Correlation Summary
| Measurement | Nicaraguan | Comanche |
| Minimum | 24.9% | 32.3% |
| Maximum | 66.1% | 62.7% |
| Range | 41.2% | 30.4% |
| Mean | 44.2% | 47.1% |
| Median | 44.6% | 46.6% |
| Interquartile 25% (IQ1) | 40.9% | 41.8% |
| Interquartile 75% (IQ3) | 47.2% | 52.1% |
| Interquartile Range (IQR) | 6.3% | 10.2% |
| Standard Deviation (Sample) | 8.4% | 7.5% |
| Standard Deviation (Population) | 8.3% | 7.4% |
Similar Demographics by Currently Married
Demographics Similar to Nicaraguans by Currently Married
In terms of currently married, the demographic groups most similar to Nicaraguans are Immigrants from Cameroon (44.2%, a difference of 0.020%), Immigrants from Eastern Africa (44.2%, a difference of 0.040%), Ugandan (44.2%, a difference of 0.090%), Blackfeet (44.2%, a difference of 0.10%), and Hispanic or Latino (44.1%, a difference of 0.12%).
| Demographics | Rating | Rank | Currently Married |
| Ethiopians | 0.7 /100 | #241 | Tragic 44.5% |
| Immigrants | Cambodia | 0.7 /100 | #242 | Tragic 44.5% |
| Immigrants | Ethiopia | 0.7 /100 | #243 | Tragic 44.5% |
| Japanese | 0.6 /100 | #244 | Tragic 44.5% |
| Immigrants | Armenia | 0.4 /100 | #245 | Tragic 44.3% |
| Immigrants | Burma/Myanmar | 0.4 /100 | #246 | Tragic 44.3% |
| Ugandans | 0.4 /100 | #247 | Tragic 44.2% |
| Nicaraguans | 0.3 /100 | #248 | Tragic 44.2% |
| Immigrants | Cameroon | 0.3 /100 | #249 | Tragic 44.2% |
| Immigrants | Eastern Africa | 0.3 /100 | #250 | Tragic 44.2% |
| Blackfeet | 0.3 /100 | #251 | Tragic 44.2% |
| Hispanics or Latinos | 0.3 /100 | #252 | Tragic 44.1% |
| Immigrants | Central America | 0.3 /100 | #253 | Tragic 44.1% |
| Vietnamese | 0.2 /100 | #254 | Tragic 44.0% |
| Yakama | 0.2 /100 | #255 | Tragic 44.0% |
Demographics Similar to Comanche by Currently Married
In terms of currently married, the demographic groups most similar to Comanche are Spanish American (45.0%, a difference of 0.0%), Immigrants from Uruguay (45.0%, a difference of 0.010%), Immigrants from Uganda (45.0%, a difference of 0.050%), French American Indian (45.0%, a difference of 0.050%), and Immigrants from Laos (45.0%, a difference of 0.10%).
| Demographics | Rating | Rank | Currently Married |
| Immigrants | Portugal | 3.5 /100 | #219 | Tragic 45.2% |
| Kenyans | 3.1 /100 | #220 | Tragic 45.2% |
| Mexicans | 3.0 /100 | #221 | Tragic 45.2% |
| Immigrants | Azores | 2.5 /100 | #222 | Tragic 45.1% |
| Immigrants | Laos | 2.3 /100 | #223 | Tragic 45.0% |
| Immigrants | Uganda | 2.2 /100 | #224 | Tragic 45.0% |
| French American Indians | 2.2 /100 | #225 | Tragic 45.0% |
| Comanche | 2.1 /100 | #226 | Tragic 45.0% |
| Spanish Americans | 2.1 /100 | #227 | Tragic 45.0% |
| Immigrants | Uruguay | 2.0 /100 | #228 | Tragic 45.0% |
| Cree | 1.7 /100 | #229 | Tragic 44.9% |
| Immigrants | Kenya | 1.6 /100 | #230 | Tragic 44.9% |
| Immigrants | Panama | 1.5 /100 | #231 | Tragic 44.9% |
| Nepalese | 1.2 /100 | #232 | Tragic 44.7% |
| Immigrants | Saudi Arabia | 1.1 /100 | #233 | Tragic 44.7% |