Mongolian vs Spaniard Currently Married
COMPARE
Mongolian
Spaniard
Currently Married
Currently Married Comparison
Mongolians
Spaniards
46.4%
CURRENTLY MARRIED
37.6/ 100
METRIC RATING
185th/ 347
METRIC RANK
46.8%
CURRENTLY MARRIED
58.8/ 100
METRIC RATING
167th/ 347
METRIC RANK
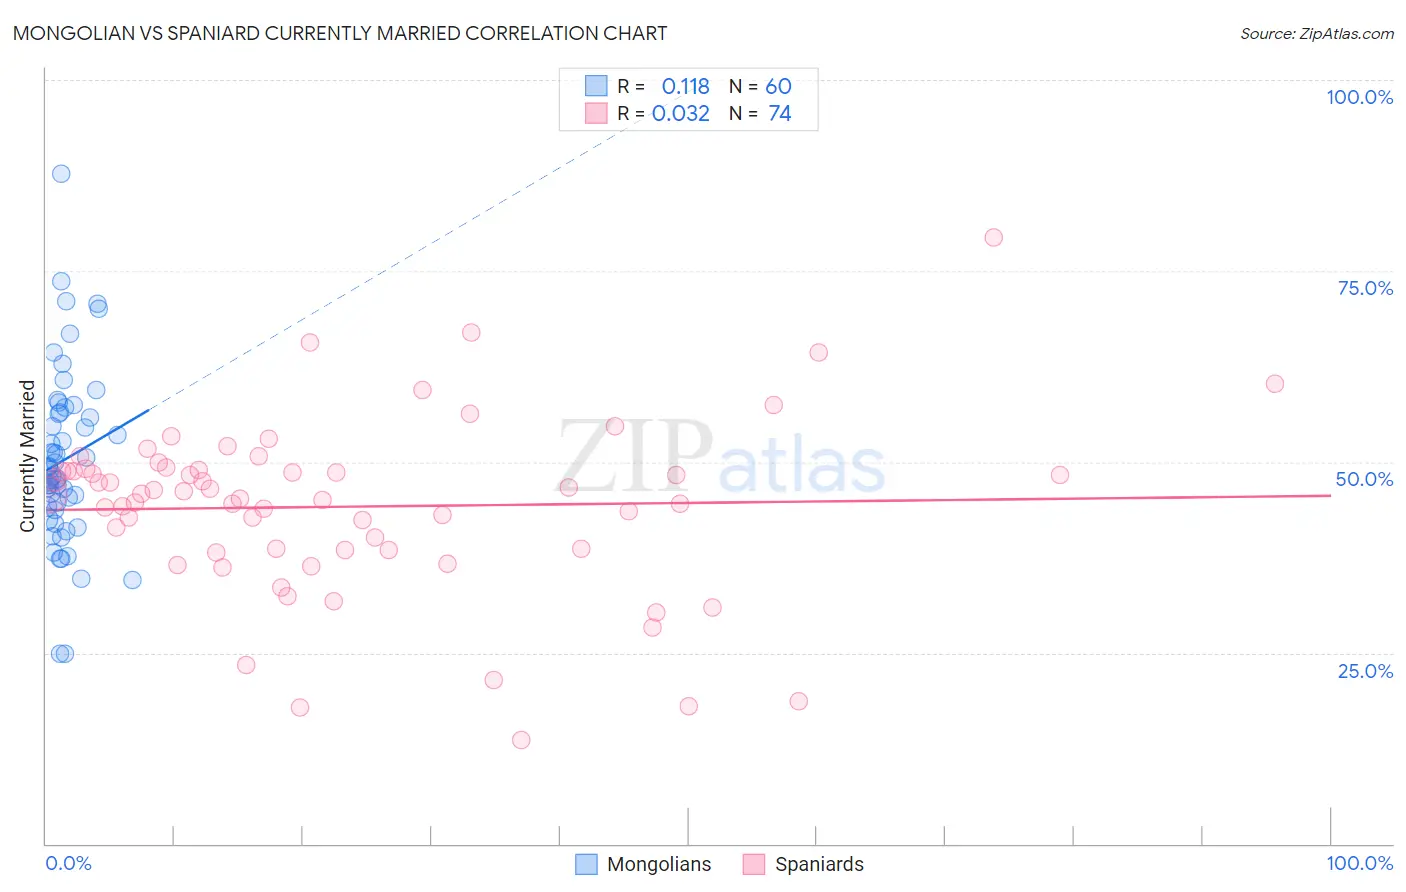
Mongolian vs Spaniard Currently Married Correlation Chart
The statistical analysis conducted on geographies consisting of 140,349,335 people shows a poor positive correlation between the proportion of Mongolians and percentage of population currently married in the United States with a correlation coefficient (R) of 0.118 and weighted average of 46.4%. Similarly, the statistical analysis conducted on geographies consisting of 443,497,994 people shows no correlation between the proportion of Spaniards and percentage of population currently married in the United States with a correlation coefficient (R) of 0.032 and weighted average of 46.8%, a difference of 0.79%.
Currently Married Correlation Summary
| Measurement | Mongolian | Spaniard |
| Minimum | 24.8% | 13.6% |
| Maximum | 87.8% | 79.3% |
| Range | 63.0% | 65.7% |
| Mean | 50.2% | 44.1% |
| Median | 48.6% | 45.8% |
| Interquartile 25% (IQ1) | 43.9% | 38.5% |
| Interquartile 75% (IQ3) | 56.3% | 48.9% |
| Interquartile Range (IQR) | 12.4% | 10.3% |
| Standard Deviation (Sample) | 11.3% | 11.5% |
| Standard Deviation (Population) | 11.3% | 11.4% |
Demographics Similar to Mongolians and Spaniards by Currently Married
In terms of currently married, the demographic groups most similar to Mongolians are Immigrants from Chile (46.4%, a difference of 0.030%), Brazilian (46.4%, a difference of 0.070%), Immigrants from Northern Africa (46.5%, a difference of 0.080%), Potawatomi (46.5%, a difference of 0.16%), and Ottawa (46.5%, a difference of 0.21%). Similarly, the demographic groups most similar to Spaniards are Immigrants from Syria (46.8%, a difference of 0.020%), Immigrants from Afghanistan (46.8%, a difference of 0.020%), Armenian (46.8%, a difference of 0.020%), Immigrants from Latvia (46.7%, a difference of 0.080%), and Immigrants from Zimbabwe (46.7%, a difference of 0.23%).
| Demographics | Rating | Rank | Currently Married |
| Immigrants | Syria | 59.3 /100 | #166 | Average 46.8% |
| Spaniards | 58.8 /100 | #167 | Average 46.8% |
| Immigrants | Afghanistan | 58.2 /100 | #168 | Average 46.8% |
| Armenians | 58.2 /100 | #169 | Average 46.8% |
| Immigrants | Latvia | 56.7 /100 | #170 | Average 46.7% |
| Immigrants | Zimbabwe | 52.4 /100 | #171 | Average 46.7% |
| Aleuts | 52.0 /100 | #172 | Average 46.7% |
| Tlingit-Haida | 51.2 /100 | #173 | Average 46.7% |
| Peruvians | 50.0 /100 | #174 | Average 46.6% |
| Immigrants | Brazil | 49.9 /100 | #175 | Average 46.6% |
| Hawaiians | 48.6 /100 | #176 | Average 46.6% |
| Israelis | 48.6 /100 | #177 | Average 46.6% |
| Chickasaw | 47.8 /100 | #178 | Average 46.6% |
| Immigrants | Oceania | 44.6 /100 | #179 | Average 46.5% |
| Costa Ricans | 43.7 /100 | #180 | Average 46.5% |
| Ottawa | 43.0 /100 | #181 | Average 46.5% |
| Potawatomi | 41.9 /100 | #182 | Average 46.5% |
| Immigrants | Northern Africa | 39.7 /100 | #183 | Fair 46.5% |
| Brazilians | 39.3 /100 | #184 | Fair 46.4% |
| Mongolians | 37.6 /100 | #185 | Fair 46.4% |
| Immigrants | Chile | 36.8 /100 | #186 | Fair 46.4% |