Norwegian vs Immigrants from Micronesia Single Father Households
COMPARE
Norwegian
Immigrants from Micronesia
Single Father Households
Single Father Households Comparison
Norwegians
Immigrants from Micronesia
2.4%
SINGLE FATHER HOUSEHOLDS
17.1/ 100
METRIC RATING
213th/ 347
METRIC RANK
2.6%
SINGLE FATHER HOUSEHOLDS
0.5/ 100
METRIC RATING
265th/ 347
METRIC RANK
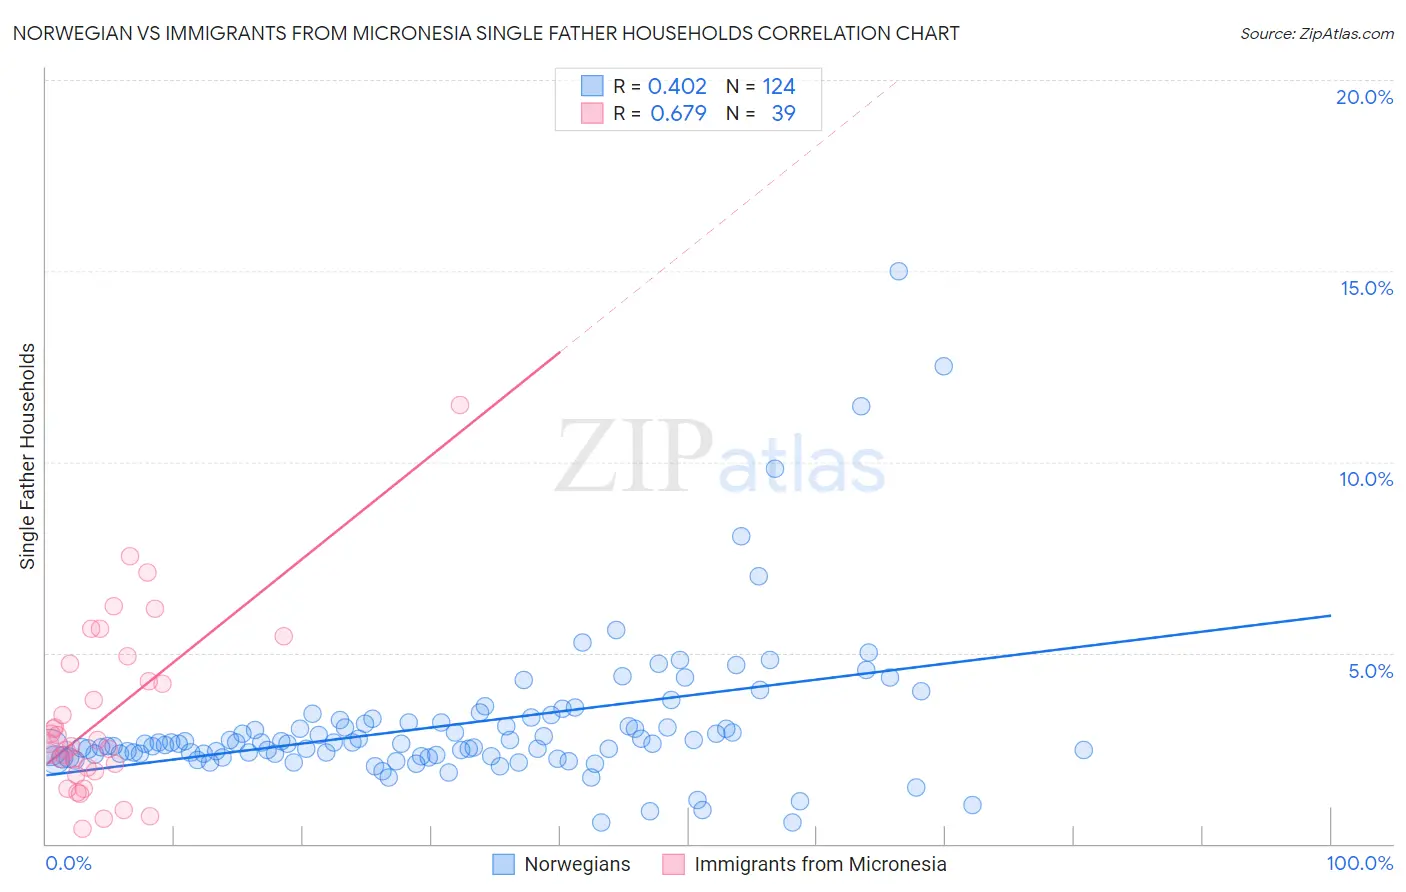
Norwegian vs Immigrants from Micronesia Single Father Households Correlation Chart
The statistical analysis conducted on geographies consisting of 522,435,304 people shows a moderate positive correlation between the proportion of Norwegians and percentage of single father households in the United States with a correlation coefficient (R) of 0.402 and weighted average of 2.4%. Similarly, the statistical analysis conducted on geographies consisting of 61,525,430 people shows a significant positive correlation between the proportion of Immigrants from Micronesia and percentage of single father households in the United States with a correlation coefficient (R) of 0.679 and weighted average of 2.6%, a difference of 6.7%.
Single Father Households Correlation Summary
| Measurement | Norwegian | Immigrants from Micronesia |
| Minimum | 0.55% | 0.38% |
| Maximum | 15.0% | 11.5% |
| Range | 14.5% | 11.1% |
| Mean | 3.1% | 3.3% |
| Median | 2.6% | 2.6% |
| Interquartile 25% (IQ1) | 2.3% | 1.9% |
| Interquartile 75% (IQ3) | 3.2% | 4.7% |
| Interquartile Range (IQR) | 0.86% | 2.8% |
| Standard Deviation (Sample) | 2.0% | 2.3% |
| Standard Deviation (Population) | 2.0% | 2.2% |
Similar Demographics by Single Father Households
Demographics Similar to Norwegians by Single Father Households
In terms of single father households, the demographic groups most similar to Norwegians are Ethiopian (2.4%, a difference of 0.060%), Finnish (2.4%, a difference of 0.15%), Immigrants from South Eastern Asia (2.4%, a difference of 0.16%), Immigrants from Nigeria (2.4%, a difference of 0.20%), and Immigrants from Costa Rica (2.4%, a difference of 0.25%).
| Demographics | Rating | Rank | Single Father Households |
| Koreans | 24.1 /100 | #206 | Fair 2.4% |
| Whites/Caucasians | 22.6 /100 | #207 | Fair 2.4% |
| Immigrants | Kenya | 20.3 /100 | #208 | Fair 2.4% |
| Immigrants | Peru | 19.3 /100 | #209 | Poor 2.4% |
| Immigrants | Costa Rica | 19.2 /100 | #210 | Poor 2.4% |
| Immigrants | Nigeria | 18.7 /100 | #211 | Poor 2.4% |
| Finns | 18.3 /100 | #212 | Poor 2.4% |
| Norwegians | 17.1 /100 | #213 | Poor 2.4% |
| Ethiopians | 16.6 /100 | #214 | Poor 2.4% |
| Immigrants | South Eastern Asia | 15.9 /100 | #215 | Poor 2.4% |
| Immigrants | Ecuador | 14.9 /100 | #216 | Poor 2.4% |
| Dutch | 14.3 /100 | #217 | Poor 2.4% |
| Immigrants | Ethiopia | 13.4 /100 | #218 | Poor 2.4% |
| Sudanese | 13.0 /100 | #219 | Poor 2.4% |
| Ghanaians | 12.9 /100 | #220 | Poor 2.4% |
Demographics Similar to Immigrants from Micronesia by Single Father Households
In terms of single father households, the demographic groups most similar to Immigrants from Micronesia are French American Indian (2.6%, a difference of 0.040%), Indonesian (2.6%, a difference of 0.060%), Guamanian/Chamorro (2.6%, a difference of 0.52%), Haitian (2.6%, a difference of 0.56%), and Dominican (2.5%, a difference of 0.75%).
| Demographics | Rating | Rank | Single Father Households |
| Spanish | 1.1 /100 | #258 | Tragic 2.5% |
| Comanche | 1.0 /100 | #259 | Tragic 2.5% |
| Immigrants | Caribbean | 1.0 /100 | #260 | Tragic 2.5% |
| Immigrants | Belize | 0.9 /100 | #261 | Tragic 2.5% |
| Immigrants | Liberia | 0.8 /100 | #262 | Tragic 2.5% |
| Dominicans | 0.8 /100 | #263 | Tragic 2.5% |
| Indonesians | 0.5 /100 | #264 | Tragic 2.6% |
| Immigrants | Micronesia | 0.5 /100 | #265 | Tragic 2.6% |
| French American Indians | 0.5 /100 | #266 | Tragic 2.6% |
| Guamanians/Chamorros | 0.4 /100 | #267 | Tragic 2.6% |
| Haitians | 0.4 /100 | #268 | Tragic 2.6% |
| Cubans | 0.3 /100 | #269 | Tragic 2.6% |
| Seminole | 0.3 /100 | #270 | Tragic 2.6% |
| Creek | 0.2 /100 | #271 | Tragic 2.6% |
| Belizeans | 0.2 /100 | #272 | Tragic 2.6% |