Belgian vs Immigrants from Micronesia Single Father Households
COMPARE
Belgian
Immigrants from Micronesia
Single Father Households
Single Father Households Comparison
Belgians
Immigrants from Micronesia
2.3%
SINGLE FATHER HOUSEHOLDS
43.3/ 100
METRIC RATING
182nd/ 347
METRIC RANK
2.6%
SINGLE FATHER HOUSEHOLDS
0.5/ 100
METRIC RATING
265th/ 347
METRIC RANK
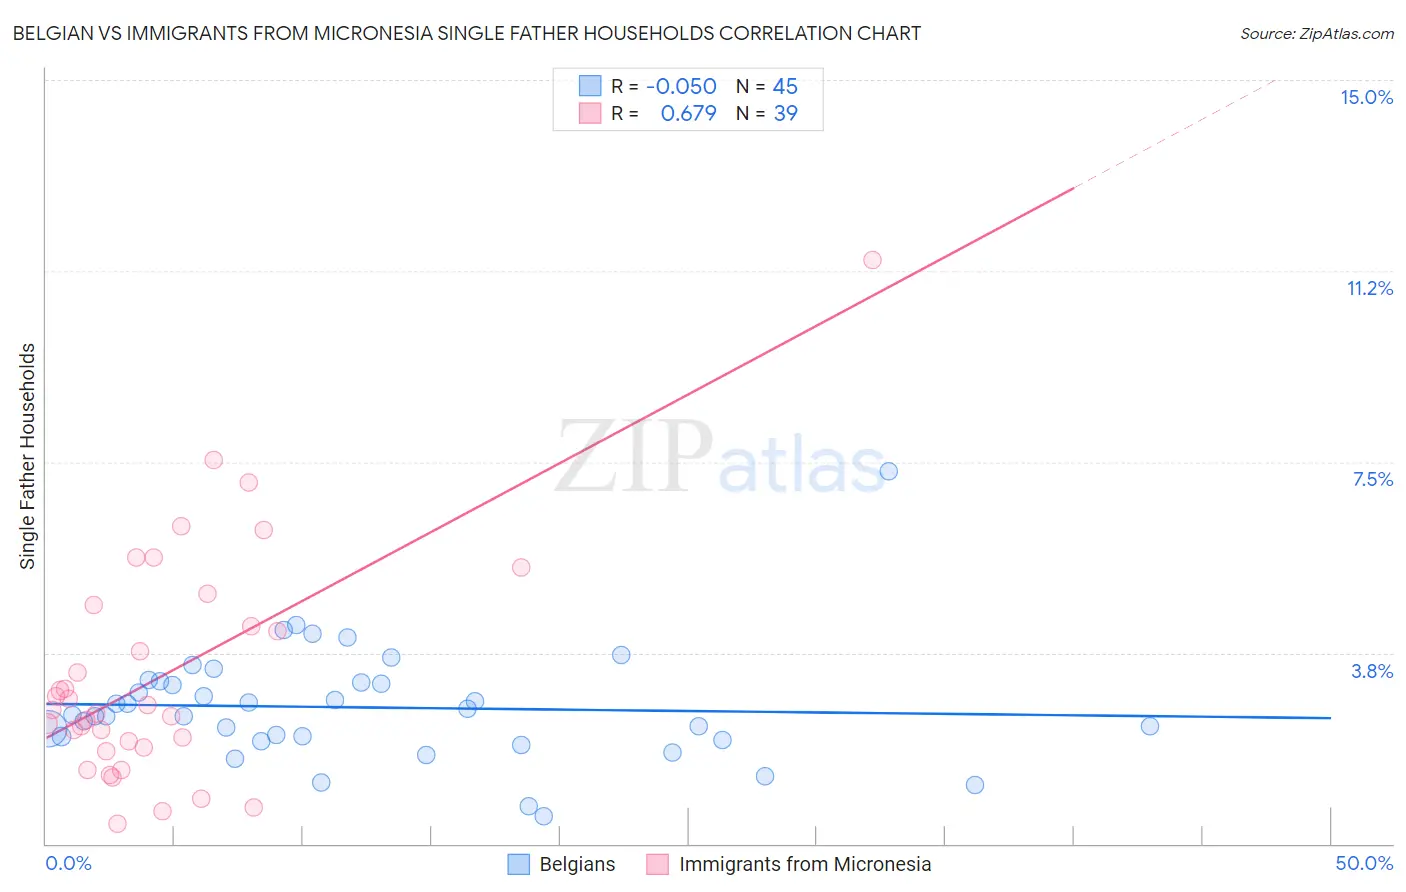
Belgian vs Immigrants from Micronesia Single Father Households Correlation Chart
The statistical analysis conducted on geographies consisting of 352,865,149 people shows a slight negative correlation between the proportion of Belgians and percentage of single father households in the United States with a correlation coefficient (R) of -0.050 and weighted average of 2.3%. Similarly, the statistical analysis conducted on geographies consisting of 61,525,430 people shows a significant positive correlation between the proportion of Immigrants from Micronesia and percentage of single father households in the United States with a correlation coefficient (R) of 0.679 and weighted average of 2.6%, a difference of 9.2%.
Single Father Households Correlation Summary
| Measurement | Belgian | Immigrants from Micronesia |
| Minimum | 0.55% | 0.38% |
| Maximum | 7.3% | 11.5% |
| Range | 6.8% | 11.1% |
| Mean | 2.7% | 3.3% |
| Median | 2.5% | 2.6% |
| Interquartile 25% (IQ1) | 2.1% | 1.9% |
| Interquartile 75% (IQ3) | 3.2% | 4.7% |
| Interquartile Range (IQR) | 1.1% | 2.8% |
| Standard Deviation (Sample) | 1.1% | 2.3% |
| Standard Deviation (Population) | 1.1% | 2.2% |
Similar Demographics by Single Father Households
Demographics Similar to Belgians by Single Father Households
In terms of single father households, the demographic groups most similar to Belgians are Jamaican (2.3%, a difference of 0.020%), Yugoslavian (2.3%, a difference of 0.040%), Costa Rican (2.3%, a difference of 0.060%), Welsh (2.3%, a difference of 0.060%), and Immigrants from Panama (2.4%, a difference of 0.11%).
| Demographics | Rating | Rank | Single Father Households |
| Immigrants | Jamaica | 49.1 /100 | #175 | Average 2.3% |
| Danes | 48.2 /100 | #176 | Average 2.3% |
| Colombians | 48.0 /100 | #177 | Average 2.3% |
| Costa Ricans | 44.1 /100 | #178 | Average 2.3% |
| Welsh | 44.0 /100 | #179 | Average 2.3% |
| Yugoslavians | 43.9 /100 | #180 | Average 2.3% |
| Jamaicans | 43.5 /100 | #181 | Average 2.3% |
| Belgians | 43.3 /100 | #182 | Average 2.3% |
| Immigrants | Panama | 41.8 /100 | #183 | Average 2.4% |
| Sri Lankans | 41.8 /100 | #184 | Average 2.4% |
| Nigerians | 41.0 /100 | #185 | Average 2.4% |
| Immigrants | Bosnia and Herzegovina | 40.4 /100 | #186 | Average 2.4% |
| Immigrants | Colombia | 34.0 /100 | #187 | Fair 2.4% |
| Hmong | 33.0 /100 | #188 | Fair 2.4% |
| U.S. Virgin Islanders | 31.8 /100 | #189 | Fair 2.4% |
Demographics Similar to Immigrants from Micronesia by Single Father Households
In terms of single father households, the demographic groups most similar to Immigrants from Micronesia are French American Indian (2.6%, a difference of 0.040%), Indonesian (2.6%, a difference of 0.060%), Guamanian/Chamorro (2.6%, a difference of 0.52%), Haitian (2.6%, a difference of 0.56%), and Dominican (2.5%, a difference of 0.75%).
| Demographics | Rating | Rank | Single Father Households |
| Spanish | 1.1 /100 | #258 | Tragic 2.5% |
| Comanche | 1.0 /100 | #259 | Tragic 2.5% |
| Immigrants | Caribbean | 1.0 /100 | #260 | Tragic 2.5% |
| Immigrants | Belize | 0.9 /100 | #261 | Tragic 2.5% |
| Immigrants | Liberia | 0.8 /100 | #262 | Tragic 2.5% |
| Dominicans | 0.8 /100 | #263 | Tragic 2.5% |
| Indonesians | 0.5 /100 | #264 | Tragic 2.6% |
| Immigrants | Micronesia | 0.5 /100 | #265 | Tragic 2.6% |
| French American Indians | 0.5 /100 | #266 | Tragic 2.6% |
| Guamanians/Chamorros | 0.4 /100 | #267 | Tragic 2.6% |
| Haitians | 0.4 /100 | #268 | Tragic 2.6% |
| Cubans | 0.3 /100 | #269 | Tragic 2.6% |
| Seminole | 0.3 /100 | #270 | Tragic 2.6% |
| Creek | 0.2 /100 | #271 | Tragic 2.6% |
| Belizeans | 0.2 /100 | #272 | Tragic 2.6% |