Chilean vs Immigrants from Micronesia Single Father Households
COMPARE
Chilean
Immigrants from Micronesia
Single Father Households
Single Father Households Comparison
Chileans
Immigrants from Micronesia
2.2%
SINGLE FATHER HOUSEHOLDS
94.5/ 100
METRIC RATING
136th/ 347
METRIC RANK
2.6%
SINGLE FATHER HOUSEHOLDS
0.5/ 100
METRIC RATING
265th/ 347
METRIC RANK
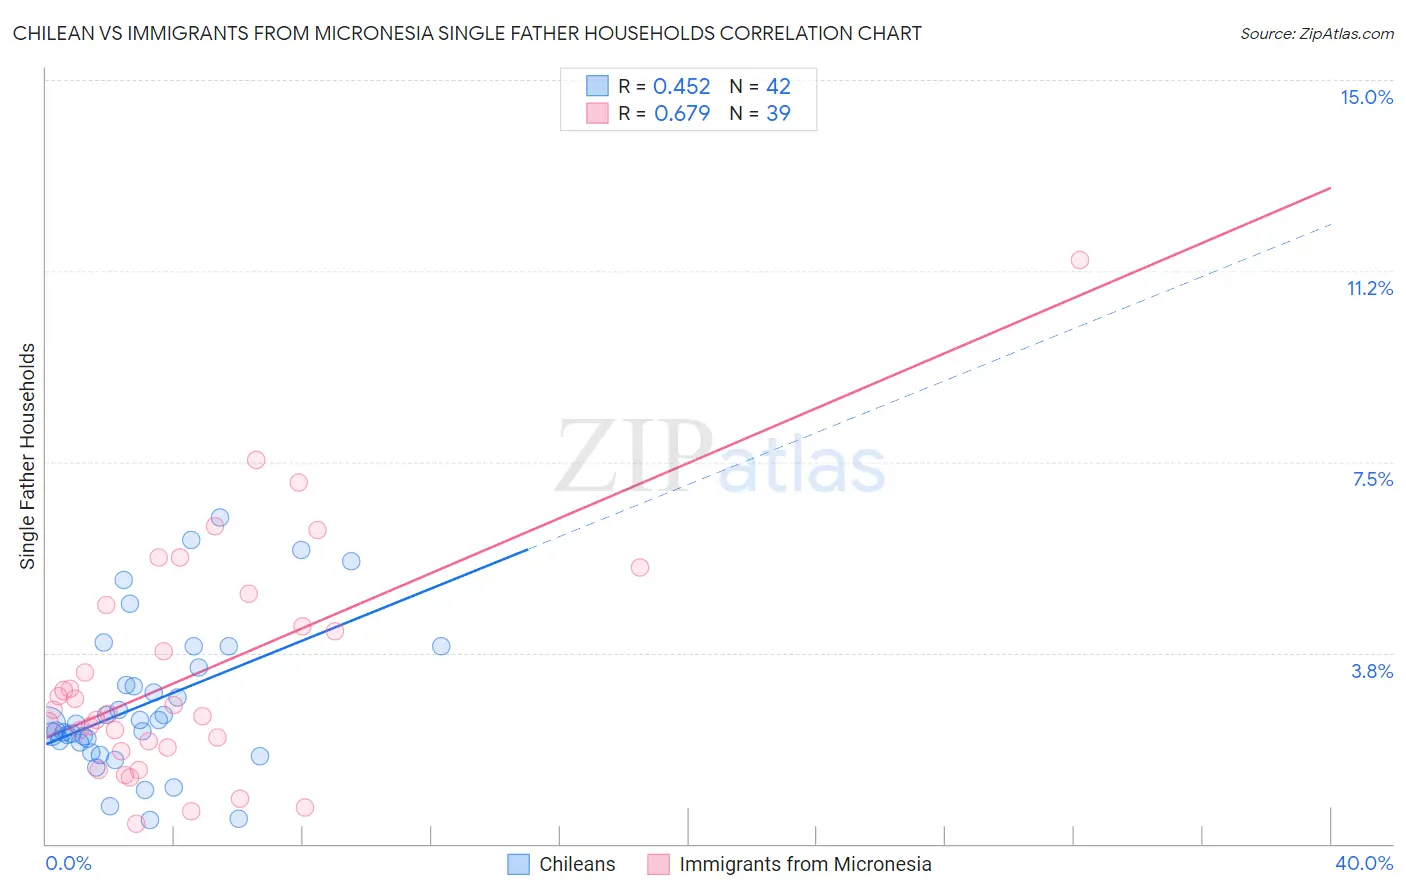
Chilean vs Immigrants from Micronesia Single Father Households Correlation Chart
The statistical analysis conducted on geographies consisting of 255,538,332 people shows a moderate positive correlation between the proportion of Chileans and percentage of single father households in the United States with a correlation coefficient (R) of 0.452 and weighted average of 2.2%. Similarly, the statistical analysis conducted on geographies consisting of 61,525,430 people shows a significant positive correlation between the proportion of Immigrants from Micronesia and percentage of single father households in the United States with a correlation coefficient (R) of 0.679 and weighted average of 2.6%, a difference of 15.8%.
Single Father Households Correlation Summary
| Measurement | Chilean | Immigrants from Micronesia |
| Minimum | 0.46% | 0.38% |
| Maximum | 6.4% | 11.5% |
| Range | 6.0% | 11.1% |
| Mean | 2.7% | 3.3% |
| Median | 2.3% | 2.6% |
| Interquartile 25% (IQ1) | 2.0% | 1.9% |
| Interquartile 75% (IQ3) | 3.5% | 4.7% |
| Interquartile Range (IQR) | 1.5% | 2.8% |
| Standard Deviation (Sample) | 1.5% | 2.3% |
| Standard Deviation (Population) | 1.4% | 2.2% |
Similar Demographics by Single Father Households
Demographics Similar to Chileans by Single Father Households
In terms of single father households, the demographic groups most similar to Chileans are Austrian (2.2%, a difference of 0.11%), Syrian (2.2%, a difference of 0.12%), West Indian (2.2%, a difference of 0.14%), Zimbabwean (2.2%, a difference of 0.23%), and Brazilian (2.2%, a difference of 0.56%).
| Demographics | Rating | Rank | Single Father Households |
| Serbians | 96.8 /100 | #129 | Exceptional 2.2% |
| Immigrants | Chile | 96.7 /100 | #130 | Exceptional 2.2% |
| Immigrants | Jordan | 96.6 /100 | #131 | Exceptional 2.2% |
| Poles | 96.5 /100 | #132 | Exceptional 2.2% |
| Taiwanese | 96.3 /100 | #133 | Exceptional 2.2% |
| Zimbabweans | 95.1 /100 | #134 | Exceptional 2.2% |
| Syrians | 94.8 /100 | #135 | Exceptional 2.2% |
| Chileans | 94.5 /100 | #136 | Exceptional 2.2% |
| Austrians | 94.2 /100 | #137 | Exceptional 2.2% |
| West Indians | 94.1 /100 | #138 | Exceptional 2.2% |
| Brazilians | 92.8 /100 | #139 | Exceptional 2.2% |
| British | 92.8 /100 | #140 | Exceptional 2.2% |
| Laotians | 92.5 /100 | #141 | Exceptional 2.2% |
| Luxembourgers | 92.3 /100 | #142 | Exceptional 2.2% |
| Immigrants | Nepal | 92.1 /100 | #143 | Exceptional 2.2% |
Demographics Similar to Immigrants from Micronesia by Single Father Households
In terms of single father households, the demographic groups most similar to Immigrants from Micronesia are French American Indian (2.6%, a difference of 0.040%), Indonesian (2.6%, a difference of 0.060%), Guamanian/Chamorro (2.6%, a difference of 0.52%), Haitian (2.6%, a difference of 0.56%), and Dominican (2.5%, a difference of 0.75%).
| Demographics | Rating | Rank | Single Father Households |
| Spanish | 1.1 /100 | #258 | Tragic 2.5% |
| Comanche | 1.0 /100 | #259 | Tragic 2.5% |
| Immigrants | Caribbean | 1.0 /100 | #260 | Tragic 2.5% |
| Immigrants | Belize | 0.9 /100 | #261 | Tragic 2.5% |
| Immigrants | Liberia | 0.8 /100 | #262 | Tragic 2.5% |
| Dominicans | 0.8 /100 | #263 | Tragic 2.5% |
| Indonesians | 0.5 /100 | #264 | Tragic 2.6% |
| Immigrants | Micronesia | 0.5 /100 | #265 | Tragic 2.6% |
| French American Indians | 0.5 /100 | #266 | Tragic 2.6% |
| Guamanians/Chamorros | 0.4 /100 | #267 | Tragic 2.6% |
| Haitians | 0.4 /100 | #268 | Tragic 2.6% |
| Cubans | 0.3 /100 | #269 | Tragic 2.6% |
| Seminole | 0.3 /100 | #270 | Tragic 2.6% |
| Creek | 0.2 /100 | #271 | Tragic 2.6% |
| Belizeans | 0.2 /100 | #272 | Tragic 2.6% |