Mexican vs Immigrants from Ecuador Single Father Households
COMPARE
Mexican
Immigrants from Ecuador
Single Father Households
Single Father Households Comparison
Mexicans
Immigrants from Ecuador
3.0%
SINGLE FATHER HOUSEHOLDS
0.0/ 100
METRIC RATING
321st/ 347
METRIC RANK
2.4%
SINGLE FATHER HOUSEHOLDS
14.9/ 100
METRIC RATING
216th/ 347
METRIC RANK
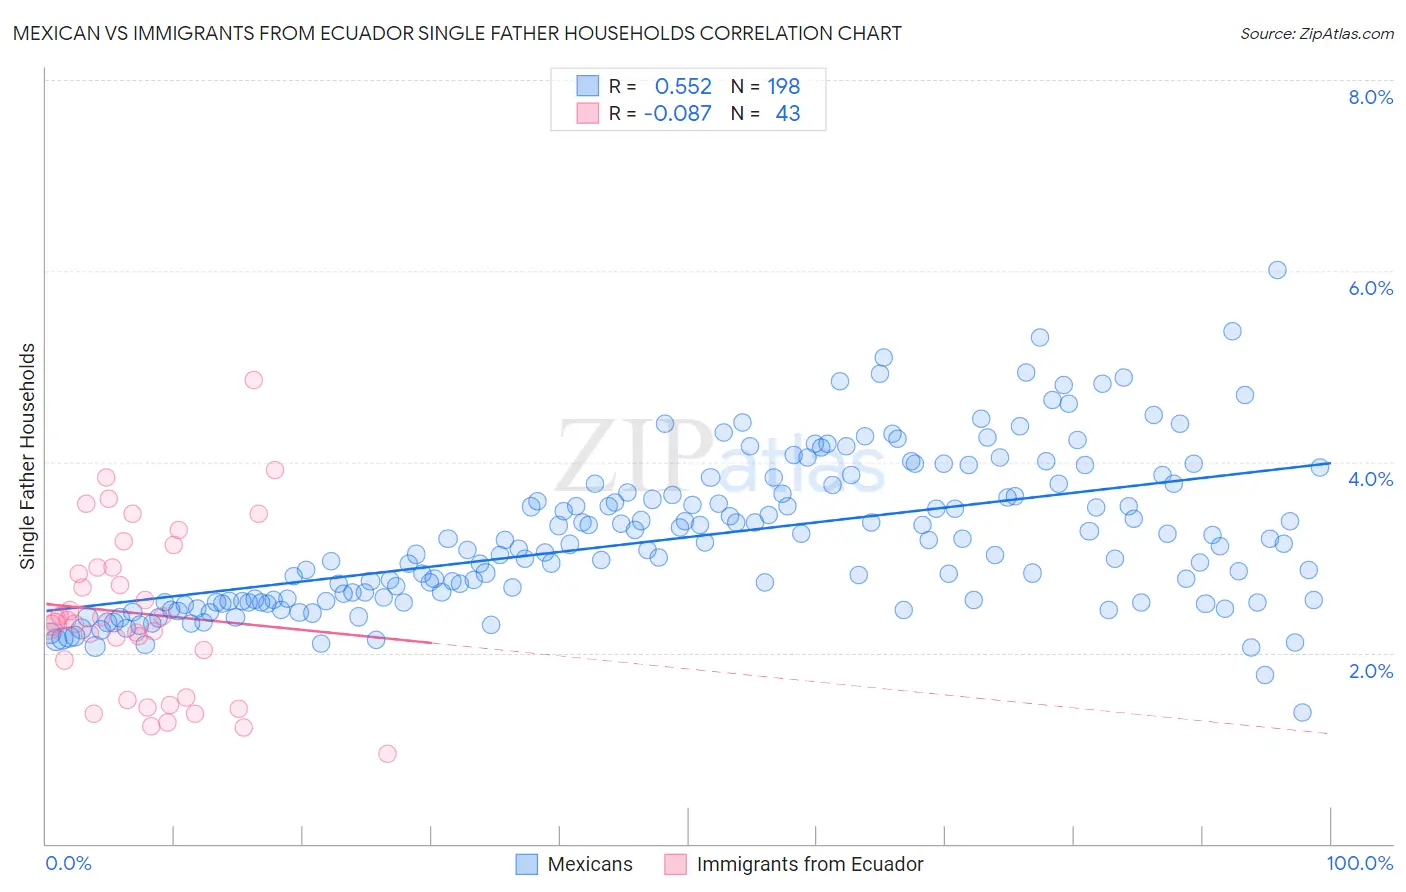
Mexican vs Immigrants from Ecuador Single Father Households Correlation Chart
The statistical analysis conducted on geographies consisting of 552,061,911 people shows a substantial positive correlation between the proportion of Mexicans and percentage of single father households in the United States with a correlation coefficient (R) of 0.552 and weighted average of 3.0%. Similarly, the statistical analysis conducted on geographies consisting of 269,379,294 people shows a slight negative correlation between the proportion of Immigrants from Ecuador and percentage of single father households in the United States with a correlation coefficient (R) of -0.087 and weighted average of 2.4%, a difference of 23.4%.
Single Father Households Correlation Summary
| Measurement | Mexican | Immigrants from Ecuador |
| Minimum | 1.4% | 0.94% |
| Maximum | 6.0% | 4.9% |
| Range | 4.6% | 3.9% |
| Mean | 3.2% | 2.4% |
| Median | 3.1% | 2.3% |
| Interquartile 25% (IQ1) | 2.5% | 1.5% |
| Interquartile 75% (IQ3) | 3.7% | 2.9% |
| Interquartile Range (IQR) | 1.1% | 1.4% |
| Standard Deviation (Sample) | 0.81% | 0.87% |
| Standard Deviation (Population) | 0.80% | 0.86% |
Similar Demographics by Single Father Households
Demographics Similar to Mexicans by Single Father Households
In terms of single father households, the demographic groups most similar to Mexicans are Guatemalan (3.0%, a difference of 0.39%), Ute (3.0%, a difference of 0.47%), Immigrants from Guatemala (3.0%, a difference of 0.53%), Immigrants from Central America (3.0%, a difference of 0.84%), and Fijian (3.0%, a difference of 0.92%).
| Demographics | Rating | Rank | Single Father Households |
| Salvadorans | 0.0 /100 | #314 | Tragic 2.9% |
| Cheyenne | 0.0 /100 | #315 | Tragic 2.9% |
| Houma | 0.0 /100 | #316 | Tragic 2.9% |
| Immigrants | El Salvador | 0.0 /100 | #317 | Tragic 2.9% |
| Cape Verdeans | 0.0 /100 | #318 | Tragic 2.9% |
| Ute | 0.0 /100 | #319 | Tragic 3.0% |
| Guatemalans | 0.0 /100 | #320 | Tragic 3.0% |
| Mexicans | 0.0 /100 | #321 | Tragic 3.0% |
| Immigrants | Guatemala | 0.0 /100 | #322 | Tragic 3.0% |
| Immigrants | Central America | 0.0 /100 | #323 | Tragic 3.0% |
| Fijians | 0.0 /100 | #324 | Tragic 3.0% |
| Immigrants | Mexico | 0.0 /100 | #325 | Tragic 3.0% |
| Aleuts | 0.0 /100 | #326 | Tragic 3.0% |
| Bangladeshis | 0.0 /100 | #327 | Tragic 3.1% |
| Immigrants | Cabo Verde | 0.0 /100 | #328 | Tragic 3.1% |
Demographics Similar to Immigrants from Ecuador by Single Father Households
In terms of single father households, the demographic groups most similar to Immigrants from Ecuador are Dutch (2.4%, a difference of 0.090%), Immigrants from South Eastern Asia (2.4%, a difference of 0.13%), Immigrants from Ethiopia (2.4%, a difference of 0.22%), Ethiopian (2.4%, a difference of 0.23%), and Norwegian (2.4%, a difference of 0.29%).
| Demographics | Rating | Rank | Single Father Households |
| Immigrants | Peru | 19.3 /100 | #209 | Poor 2.4% |
| Immigrants | Costa Rica | 19.2 /100 | #210 | Poor 2.4% |
| Immigrants | Nigeria | 18.7 /100 | #211 | Poor 2.4% |
| Finns | 18.3 /100 | #212 | Poor 2.4% |
| Norwegians | 17.1 /100 | #213 | Poor 2.4% |
| Ethiopians | 16.6 /100 | #214 | Poor 2.4% |
| Immigrants | South Eastern Asia | 15.9 /100 | #215 | Poor 2.4% |
| Immigrants | Ecuador | 14.9 /100 | #216 | Poor 2.4% |
| Dutch | 14.3 /100 | #217 | Poor 2.4% |
| Immigrants | Ethiopia | 13.4 /100 | #218 | Poor 2.4% |
| Sudanese | 13.0 /100 | #219 | Poor 2.4% |
| Ghanaians | 12.9 /100 | #220 | Poor 2.4% |
| Immigrants | Burma/Myanmar | 12.1 /100 | #221 | Poor 2.4% |
| Immigrants | Eastern Africa | 11.9 /100 | #222 | Poor 2.4% |
| Immigrants | Uruguay | 11.0 /100 | #223 | Poor 2.4% |