Mexican vs Barbadian Single Father Households
COMPARE
Mexican
Barbadian
Single Father Households
Single Father Households Comparison
Mexicans
Barbadians
3.0%
SINGLE FATHER HOUSEHOLDS
0.0/ 100
METRIC RATING
321st/ 347
METRIC RANK
2.2%
SINGLE FATHER HOUSEHOLDS
98.4/ 100
METRIC RATING
109th/ 347
METRIC RANK
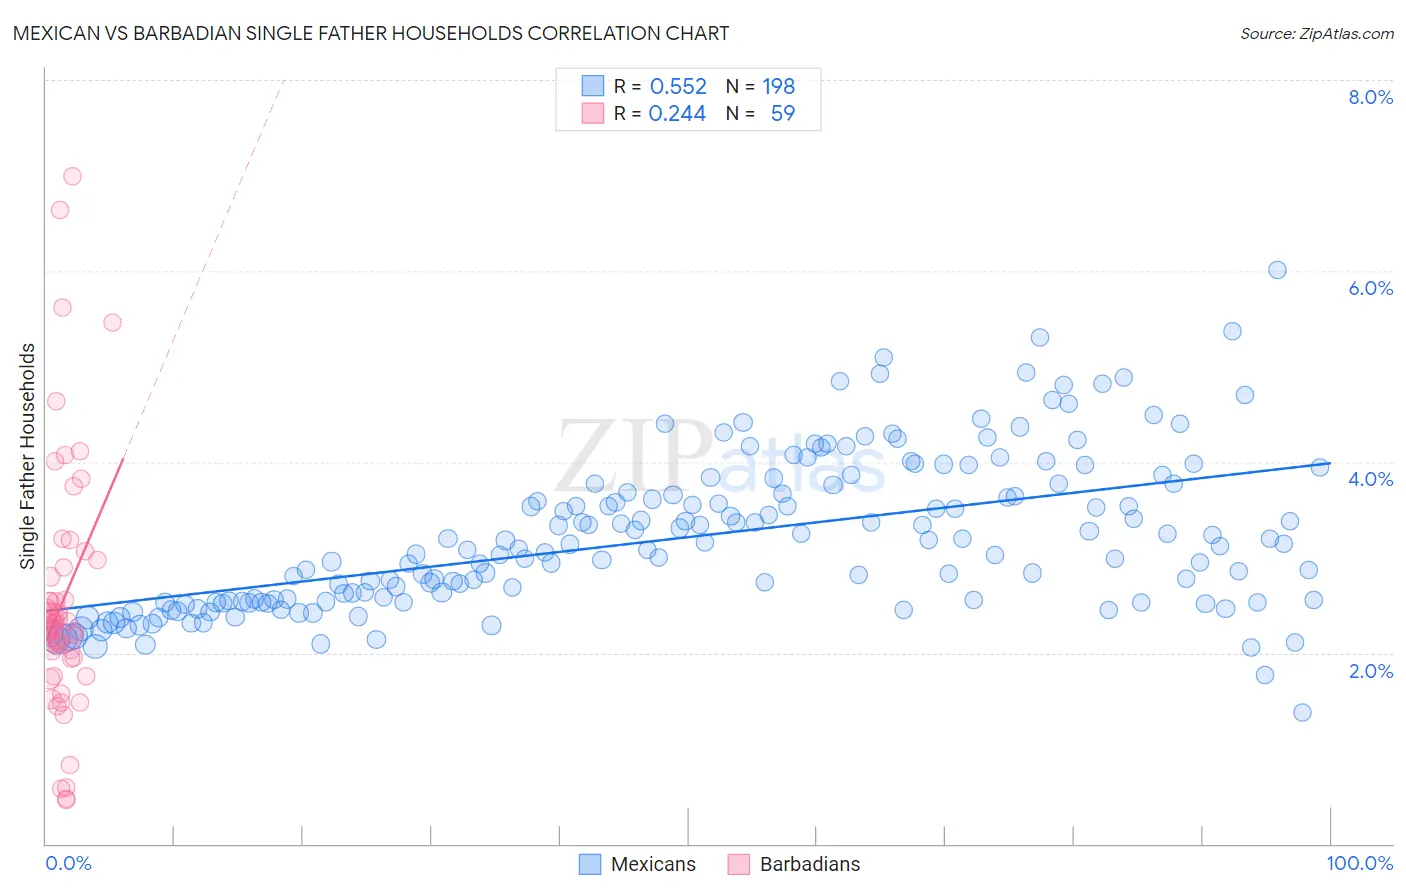
Mexican vs Barbadian Single Father Households Correlation Chart
The statistical analysis conducted on geographies consisting of 552,061,911 people shows a substantial positive correlation between the proportion of Mexicans and percentage of single father households in the United States with a correlation coefficient (R) of 0.552 and weighted average of 3.0%. Similarly, the statistical analysis conducted on geographies consisting of 140,972,494 people shows a weak positive correlation between the proportion of Barbadians and percentage of single father households in the United States with a correlation coefficient (R) of 0.244 and weighted average of 2.2%, a difference of 37.8%.
Single Father Households Correlation Summary
| Measurement | Mexican | Barbadian |
| Minimum | 1.4% | 0.46% |
| Maximum | 6.0% | 7.0% |
| Range | 4.6% | 6.5% |
| Mean | 3.2% | 2.5% |
| Median | 3.1% | 2.3% |
| Interquartile 25% (IQ1) | 2.5% | 1.9% |
| Interquartile 75% (IQ3) | 3.7% | 2.9% |
| Interquartile Range (IQR) | 1.1% | 0.95% |
| Standard Deviation (Sample) | 0.81% | 1.3% |
| Standard Deviation (Population) | 0.80% | 1.3% |
Similar Demographics by Single Father Households
Demographics Similar to Mexicans by Single Father Households
In terms of single father households, the demographic groups most similar to Mexicans are Guatemalan (3.0%, a difference of 0.39%), Ute (3.0%, a difference of 0.47%), Immigrants from Guatemala (3.0%, a difference of 0.53%), Immigrants from Central America (3.0%, a difference of 0.84%), and Fijian (3.0%, a difference of 0.92%).
| Demographics | Rating | Rank | Single Father Households |
| Salvadorans | 0.0 /100 | #314 | Tragic 2.9% |
| Cheyenne | 0.0 /100 | #315 | Tragic 2.9% |
| Houma | 0.0 /100 | #316 | Tragic 2.9% |
| Immigrants | El Salvador | 0.0 /100 | #317 | Tragic 2.9% |
| Cape Verdeans | 0.0 /100 | #318 | Tragic 2.9% |
| Ute | 0.0 /100 | #319 | Tragic 3.0% |
| Guatemalans | 0.0 /100 | #320 | Tragic 3.0% |
| Mexicans | 0.0 /100 | #321 | Tragic 3.0% |
| Immigrants | Guatemala | 0.0 /100 | #322 | Tragic 3.0% |
| Immigrants | Central America | 0.0 /100 | #323 | Tragic 3.0% |
| Fijians | 0.0 /100 | #324 | Tragic 3.0% |
| Immigrants | Mexico | 0.0 /100 | #325 | Tragic 3.0% |
| Aleuts | 0.0 /100 | #326 | Tragic 3.0% |
| Bangladeshis | 0.0 /100 | #327 | Tragic 3.1% |
| Immigrants | Cabo Verde | 0.0 /100 | #328 | Tragic 3.1% |
Demographics Similar to Barbadians by Single Father Households
In terms of single father households, the demographic groups most similar to Barbadians are Immigrants from Netherlands (2.2%, a difference of 0.040%), Slovene (2.2%, a difference of 0.060%), Italian (2.2%, a difference of 0.13%), Immigrants from Southern Europe (2.2%, a difference of 0.17%), and Immigrants from Canada (2.2%, a difference of 0.21%).
| Demographics | Rating | Rank | Single Father Households |
| Argentineans | 98.9 /100 | #102 | Exceptional 2.1% |
| Lebanese | 98.9 /100 | #103 | Exceptional 2.1% |
| Alsatians | 98.9 /100 | #104 | Exceptional 2.1% |
| Palestinians | 98.6 /100 | #105 | Exceptional 2.2% |
| Immigrants | Southern Europe | 98.6 /100 | #106 | Exceptional 2.2% |
| Slovenes | 98.5 /100 | #107 | Exceptional 2.2% |
| Immigrants | Netherlands | 98.5 /100 | #108 | Exceptional 2.2% |
| Barbadians | 98.4 /100 | #109 | Exceptional 2.2% |
| Italians | 98.3 /100 | #110 | Exceptional 2.2% |
| Immigrants | Canada | 98.3 /100 | #111 | Exceptional 2.2% |
| Immigrants | Trinidad and Tobago | 98.2 /100 | #112 | Exceptional 2.2% |
| Iraqis | 98.2 /100 | #113 | Exceptional 2.2% |
| Immigrants | North America | 98.2 /100 | #114 | Exceptional 2.2% |
| Immigrants | Barbados | 98.2 /100 | #115 | Exceptional 2.2% |
| Immigrants | Argentina | 98.1 /100 | #116 | Exceptional 2.2% |