Bolivian vs Immigrants from Micronesia Single Father Households
COMPARE
Bolivian
Immigrants from Micronesia
Single Father Households
Single Father Households Comparison
Bolivians
Immigrants from Micronesia
2.3%
SINGLE FATHER HOUSEHOLDS
81.0/ 100
METRIC RATING
154th/ 347
METRIC RANK
2.6%
SINGLE FATHER HOUSEHOLDS
0.5/ 100
METRIC RATING
265th/ 347
METRIC RANK
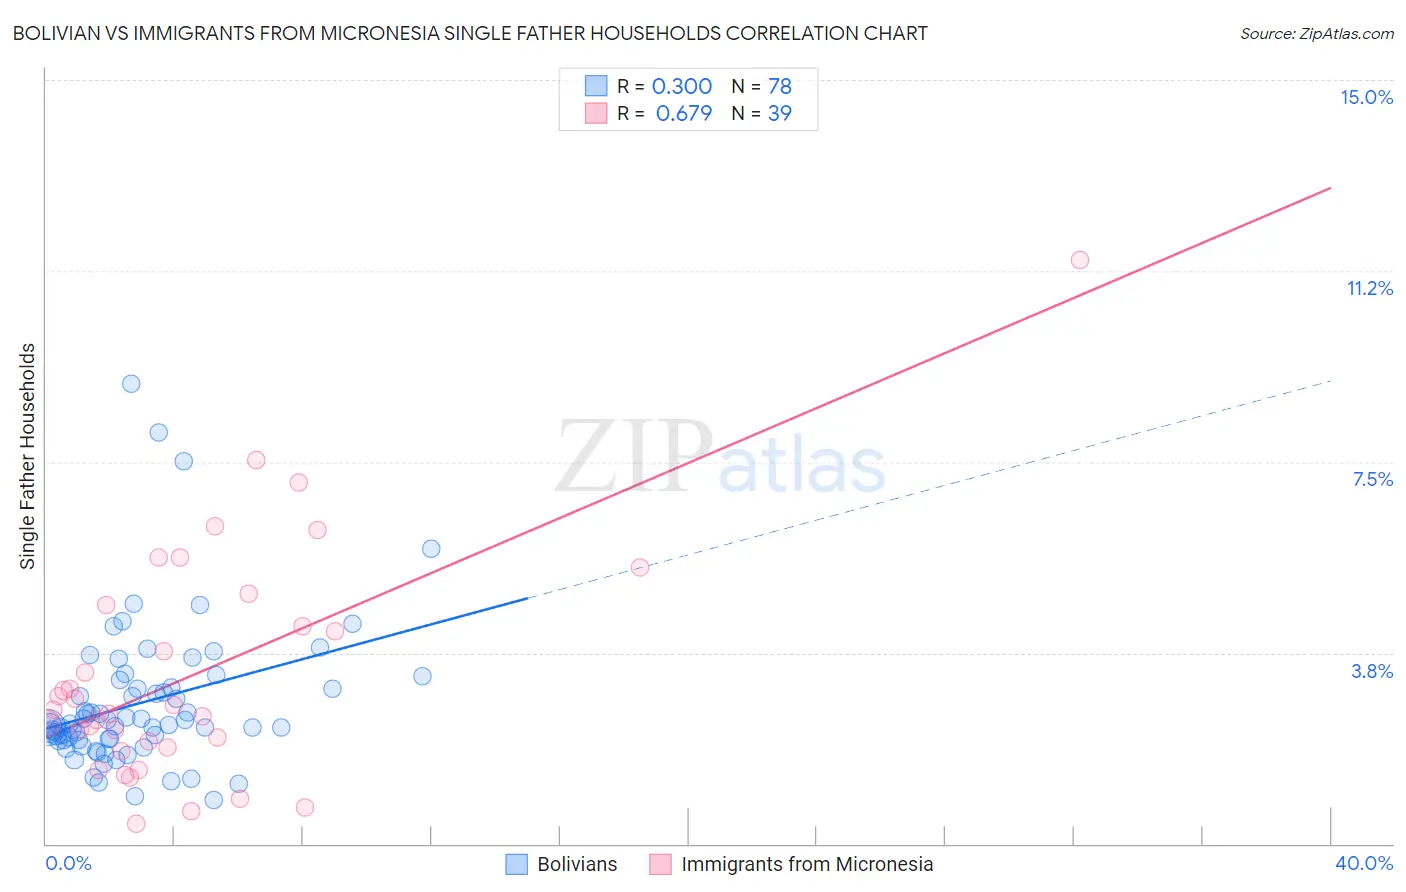
Bolivian vs Immigrants from Micronesia Single Father Households Correlation Chart
The statistical analysis conducted on geographies consisting of 184,110,694 people shows a mild positive correlation between the proportion of Bolivians and percentage of single father households in the United States with a correlation coefficient (R) of 0.300 and weighted average of 2.3%. Similarly, the statistical analysis conducted on geographies consisting of 61,525,430 people shows a significant positive correlation between the proportion of Immigrants from Micronesia and percentage of single father households in the United States with a correlation coefficient (R) of 0.679 and weighted average of 2.6%, a difference of 12.8%.
Single Father Households Correlation Summary
| Measurement | Bolivian | Immigrants from Micronesia |
| Minimum | 0.87% | 0.38% |
| Maximum | 9.0% | 11.5% |
| Range | 8.2% | 11.1% |
| Mean | 2.8% | 3.3% |
| Median | 2.3% | 2.6% |
| Interquartile 25% (IQ1) | 2.0% | 1.9% |
| Interquartile 75% (IQ3) | 3.1% | 4.7% |
| Interquartile Range (IQR) | 1.0% | 2.8% |
| Standard Deviation (Sample) | 1.4% | 2.3% |
| Standard Deviation (Population) | 1.4% | 2.2% |
Similar Demographics by Single Father Households
Demographics Similar to Bolivians by Single Father Households
In terms of single father households, the demographic groups most similar to Bolivians are European (2.3%, a difference of 0.020%), Immigrants from South America (2.3%, a difference of 0.14%), Canadian (2.3%, a difference of 0.16%), Immigrants from Senegal (2.3%, a difference of 0.19%), and Immigrants from Germany (2.3%, a difference of 0.22%).
| Demographics | Rating | Rank | Single Father Households |
| Slavs | 88.9 /100 | #147 | Excellent 2.2% |
| South American Indians | 88.5 /100 | #148 | Excellent 2.3% |
| Senegalese | 88.4 /100 | #149 | Excellent 2.3% |
| Venezuelans | 86.2 /100 | #150 | Excellent 2.3% |
| Immigrants | Syria | 84.8 /100 | #151 | Excellent 2.3% |
| Immigrants | Venezuela | 83.2 /100 | #152 | Excellent 2.3% |
| Immigrants | Germany | 82.8 /100 | #153 | Excellent 2.3% |
| Bolivians | 81.0 /100 | #154 | Excellent 2.3% |
| Europeans | 80.9 /100 | #155 | Excellent 2.3% |
| Immigrants | South America | 79.9 /100 | #156 | Good 2.3% |
| Canadians | 79.7 /100 | #157 | Good 2.3% |
| Immigrants | Senegal | 79.4 /100 | #158 | Good 2.3% |
| Immigrants | West Indies | 77.9 /100 | #159 | Good 2.3% |
| Immigrants | Bolivia | 76.3 /100 | #160 | Good 2.3% |
| Swiss | 73.2 /100 | #161 | Good 2.3% |
Demographics Similar to Immigrants from Micronesia by Single Father Households
In terms of single father households, the demographic groups most similar to Immigrants from Micronesia are French American Indian (2.6%, a difference of 0.040%), Indonesian (2.6%, a difference of 0.060%), Guamanian/Chamorro (2.6%, a difference of 0.52%), Haitian (2.6%, a difference of 0.56%), and Dominican (2.5%, a difference of 0.75%).
| Demographics | Rating | Rank | Single Father Households |
| Spanish | 1.1 /100 | #258 | Tragic 2.5% |
| Comanche | 1.0 /100 | #259 | Tragic 2.5% |
| Immigrants | Caribbean | 1.0 /100 | #260 | Tragic 2.5% |
| Immigrants | Belize | 0.9 /100 | #261 | Tragic 2.5% |
| Immigrants | Liberia | 0.8 /100 | #262 | Tragic 2.5% |
| Dominicans | 0.8 /100 | #263 | Tragic 2.5% |
| Indonesians | 0.5 /100 | #264 | Tragic 2.6% |
| Immigrants | Micronesia | 0.5 /100 | #265 | Tragic 2.6% |
| French American Indians | 0.5 /100 | #266 | Tragic 2.6% |
| Guamanians/Chamorros | 0.4 /100 | #267 | Tragic 2.6% |
| Haitians | 0.4 /100 | #268 | Tragic 2.6% |
| Cubans | 0.3 /100 | #269 | Tragic 2.6% |
| Seminole | 0.3 /100 | #270 | Tragic 2.6% |
| Creek | 0.2 /100 | #271 | Tragic 2.6% |
| Belizeans | 0.2 /100 | #272 | Tragic 2.6% |