Estonian vs Immigrants from Cambodia Average Family Size
COMPARE
Estonian
Immigrants from Cambodia
Average Family Size
Average Family Size Comparison
Estonians
Immigrants from Cambodia
3.10
AVERAGE FAMILY SIZE
0.0/ 100
METRIC RATING
333rd/ 347
METRIC RANK
3.33
AVERAGE FAMILY SIZE
99.9/ 100
METRIC RATING
68th/ 347
METRIC RANK
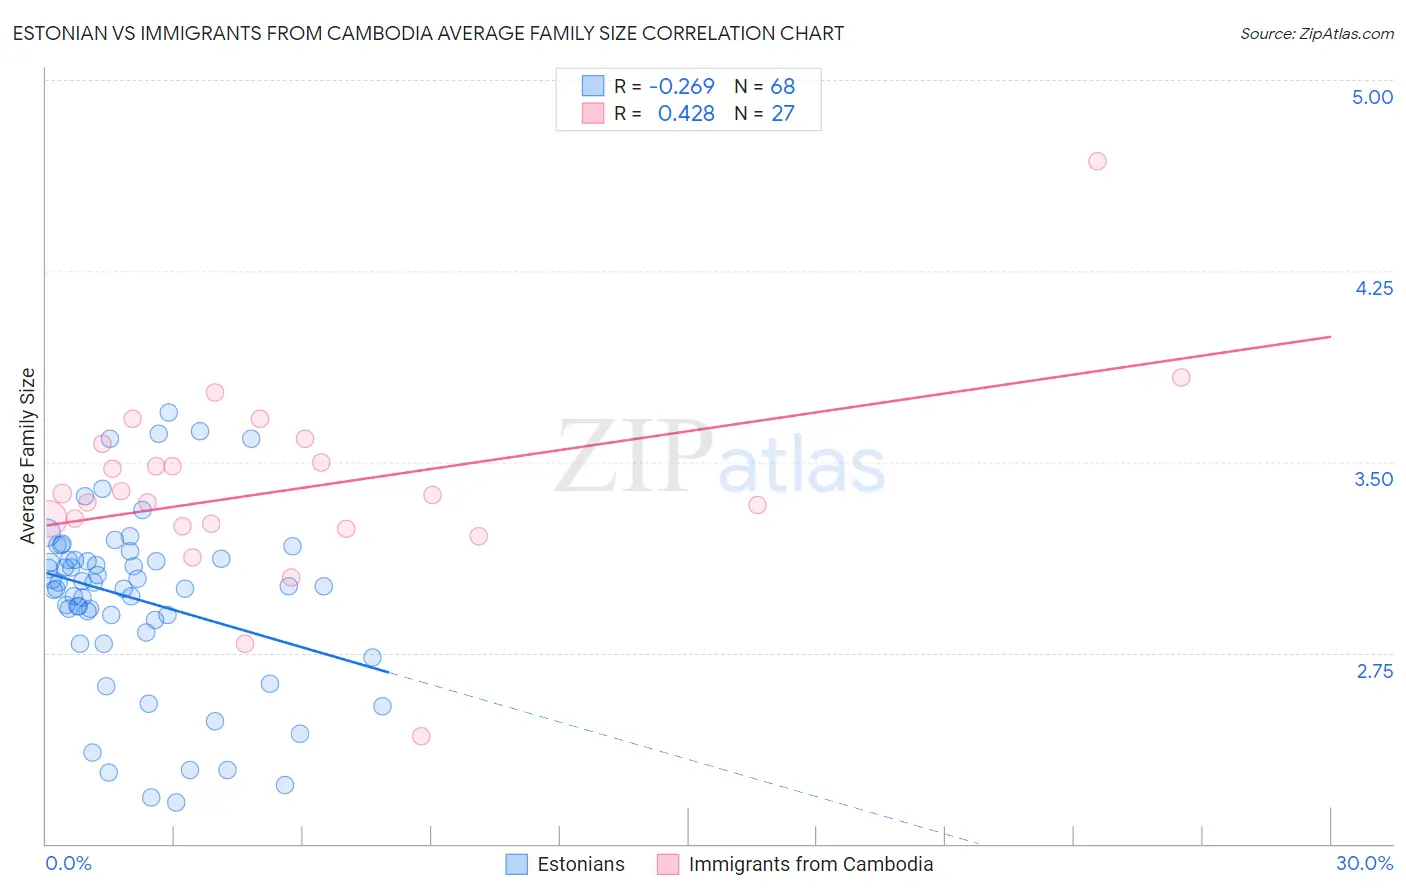
Estonian vs Immigrants from Cambodia Average Family Size Correlation Chart
The statistical analysis conducted on geographies consisting of 123,500,786 people shows a weak negative correlation between the proportion of Estonians and average family size in the United States with a correlation coefficient (R) of -0.269 and weighted average of 3.10. Similarly, the statistical analysis conducted on geographies consisting of 205,129,465 people shows a moderate positive correlation between the proportion of Immigrants from Cambodia and average family size in the United States with a correlation coefficient (R) of 0.428 and weighted average of 3.33, a difference of 7.3%.
Average Family Size Correlation Summary
| Measurement | Estonian | Immigrants from Cambodia |
| Minimum | 2.16 | 2.42 |
| Maximum | 3.69 | 4.68 |
| Range | 1.53 | 2.26 |
| Mean | 2.96 | 3.40 |
| Median | 3.01 | 3.37 |
| Interquartile 25% (IQ1) | 2.85 | 3.25 |
| Interquartile 75% (IQ3) | 3.12 | 3.57 |
| Interquartile Range (IQR) | 0.26 | 0.32 |
| Standard Deviation (Sample) | 0.35 | 0.39 |
| Standard Deviation (Population) | 0.34 | 0.38 |
Similar Demographics by Average Family Size
Demographics Similar to Estonians by Average Family Size
In terms of average family size, the demographic groups most similar to Estonians are Lithuanian (3.10, a difference of 0.0%), Luxembourger (3.10, a difference of 0.030%), Latvian (3.11, a difference of 0.050%), Scotch-Irish (3.11, a difference of 0.050%), and Scottish (3.11, a difference of 0.050%).
| Demographics | Rating | Rank | Average Family Size |
| Ottawa | 0.0 /100 | #326 | Tragic 3.11 |
| Dutch | 0.0 /100 | #327 | Tragic 3.11 |
| Czechs | 0.0 /100 | #328 | Tragic 3.11 |
| Belgians | 0.0 /100 | #329 | Tragic 3.11 |
| Latvians | 0.0 /100 | #330 | Tragic 3.11 |
| Scotch-Irish | 0.0 /100 | #331 | Tragic 3.11 |
| Scottish | 0.0 /100 | #332 | Tragic 3.11 |
| Estonians | 0.0 /100 | #333 | Tragic 3.10 |
| Lithuanians | 0.0 /100 | #334 | Tragic 3.10 |
| Luxembourgers | 0.0 /100 | #335 | Tragic 3.10 |
| Irish | 0.0 /100 | #336 | Tragic 3.10 |
| Swedes | 0.0 /100 | #337 | Tragic 3.10 |
| French | 0.0 /100 | #338 | Tragic 3.10 |
| Croatians | 0.0 /100 | #339 | Tragic 3.10 |
| Finns | 0.0 /100 | #340 | Tragic 3.09 |
Demographics Similar to Immigrants from Cambodia by Average Family Size
In terms of average family size, the demographic groups most similar to Immigrants from Cambodia are Immigrants (3.33, a difference of 0.030%), Immigrants from Jamaica (3.33, a difference of 0.080%), Immigrants from Trinidad and Tobago (3.33, a difference of 0.080%), Immigrants from West Indies (3.33, a difference of 0.090%), and Immigrants from St. Vincent and the Grenadines (3.34, a difference of 0.12%).
| Demographics | Rating | Rank | Average Family Size |
| Central American Indians | 100.0 /100 | #61 | Exceptional 3.35 |
| Immigrants | Grenada | 100.0 /100 | #62 | Exceptional 3.34 |
| Chinese | 100.0 /100 | #63 | Exceptional 3.34 |
| Dominicans | 99.9 /100 | #64 | Exceptional 3.34 |
| Immigrants | Laos | 99.9 /100 | #65 | Exceptional 3.34 |
| Immigrants | St. Vincent and the Grenadines | 99.9 /100 | #66 | Exceptional 3.34 |
| Immigrants | Jamaica | 99.9 /100 | #67 | Exceptional 3.33 |
| Immigrants | Cambodia | 99.9 /100 | #68 | Exceptional 3.33 |
| Immigrants | Immigrants | 99.9 /100 | #69 | Exceptional 3.33 |
| Immigrants | Trinidad and Tobago | 99.9 /100 | #70 | Exceptional 3.33 |
| Immigrants | West Indies | 99.9 /100 | #71 | Exceptional 3.33 |
| Immigrants | Caribbean | 99.9 /100 | #72 | Exceptional 3.33 |
| Yaqui | 99.9 /100 | #73 | Exceptional 3.32 |
| Immigrants | Sierra Leone | 99.9 /100 | #74 | Exceptional 3.32 |
| Immigrants | Barbados | 99.8 /100 | #75 | Exceptional 3.32 |