Mexican vs Welsh Average Family Size
COMPARE
Mexican
Welsh
Average Family Size
Average Family Size Comparison
Mexicans
Welsh
3.48
AVERAGE FAMILY SIZE
100.0/ 100
METRIC RATING
19th/ 347
METRIC RANK
3.12
AVERAGE FAMILY SIZE
0.1/ 100
METRIC RATING
319th/ 347
METRIC RANK
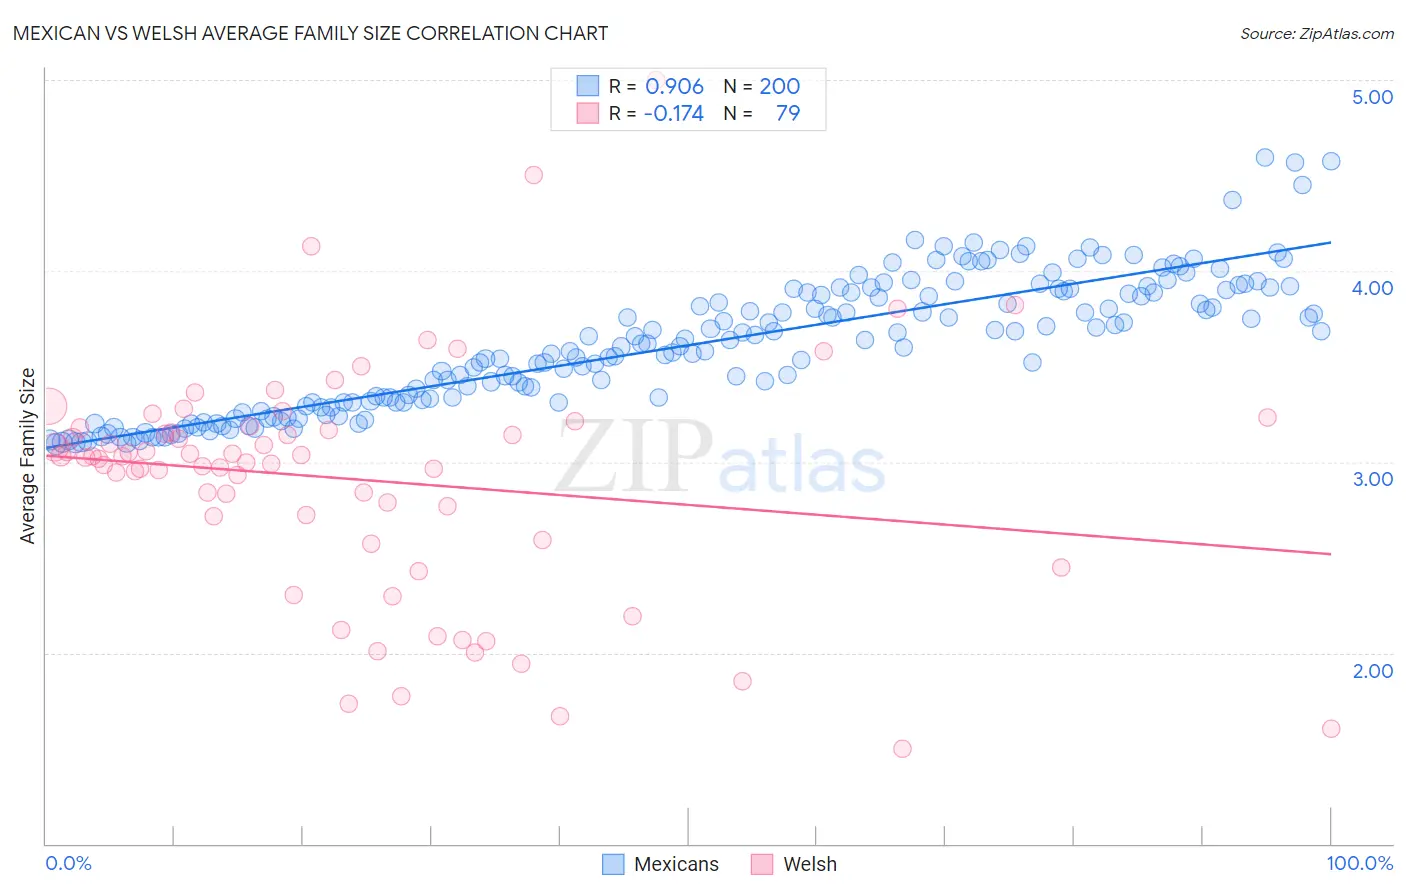
Mexican vs Welsh Average Family Size Correlation Chart
The statistical analysis conducted on geographies consisting of 564,667,700 people shows a near-perfect positive correlation between the proportion of Mexicans and average family size in the United States with a correlation coefficient (R) of 0.906 and weighted average of 3.48. Similarly, the statistical analysis conducted on geographies consisting of 528,179,662 people shows a poor negative correlation between the proportion of Welsh and average family size in the United States with a correlation coefficient (R) of -0.174 and weighted average of 3.12, a difference of 11.5%.
Average Family Size Correlation Summary
| Measurement | Mexican | Welsh |
| Minimum | 3.09 | 1.50 |
| Maximum | 4.59 | 5.00 |
| Range | 1.50 | 3.50 |
| Mean | 3.61 | 2.91 |
| Median | 3.60 | 3.02 |
| Interquartile 25% (IQ1) | 3.31 | 2.59 |
| Interquartile 75% (IQ3) | 3.89 | 3.18 |
| Interquartile Range (IQR) | 0.58 | 0.59 |
| Standard Deviation (Sample) | 0.34 | 0.62 |
| Standard Deviation (Population) | 0.34 | 0.62 |
Similar Demographics by Average Family Size
Demographics Similar to Mexicans by Average Family Size
In terms of average family size, the demographic groups most similar to Mexicans are Cheyenne (3.47, a difference of 0.040%), Salvadoran (3.48, a difference of 0.070%), Yuman (3.47, a difference of 0.30%), Immigrants from El Salvador (3.49, a difference of 0.32%), and Apache (3.46, a difference of 0.35%).
| Demographics | Rating | Rank | Average Family Size |
| Immigrants | Mexico | 100.0 /100 | #12 | Exceptional 3.52 |
| Sioux | 100.0 /100 | #13 | Exceptional 3.52 |
| Immigrants | Central America | 100.0 /100 | #14 | Exceptional 3.49 |
| Tongans | 100.0 /100 | #15 | Exceptional 3.49 |
| Ute | 100.0 /100 | #16 | Exceptional 3.49 |
| Immigrants | El Salvador | 100.0 /100 | #17 | Exceptional 3.49 |
| Salvadorans | 100.0 /100 | #18 | Exceptional 3.48 |
| Mexicans | 100.0 /100 | #19 | Exceptional 3.48 |
| Cheyenne | 100.0 /100 | #20 | Exceptional 3.47 |
| Yuman | 100.0 /100 | #21 | Exceptional 3.47 |
| Apache | 100.0 /100 | #22 | Exceptional 3.46 |
| Immigrants | Fiji | 100.0 /100 | #23 | Exceptional 3.45 |
| Natives/Alaskans | 100.0 /100 | #24 | Exceptional 3.45 |
| Yakama | 100.0 /100 | #25 | Exceptional 3.45 |
| Native Hawaiians | 100.0 /100 | #26 | Exceptional 3.43 |
Demographics Similar to Welsh by Average Family Size
In terms of average family size, the demographic groups most similar to Welsh are Eastern European (3.12, a difference of 0.0%), Italian (3.12, a difference of 0.010%), Serbian (3.12, a difference of 0.070%), Immigrants from North America (3.12, a difference of 0.070%), and Immigrants from Austria (3.12, a difference of 0.10%).
| Demographics | Rating | Rank | Average Family Size |
| Immigrants | Australia | 0.1 /100 | #312 | Tragic 3.13 |
| Bulgarians | 0.1 /100 | #313 | Tragic 3.13 |
| Russians | 0.1 /100 | #314 | Tragic 3.12 |
| Immigrants | Scotland | 0.1 /100 | #315 | Tragic 3.12 |
| Serbians | 0.1 /100 | #316 | Tragic 3.12 |
| Italians | 0.1 /100 | #317 | Tragic 3.12 |
| Eastern Europeans | 0.1 /100 | #318 | Tragic 3.12 |
| Welsh | 0.1 /100 | #319 | Tragic 3.12 |
| Immigrants | North America | 0.0 /100 | #320 | Tragic 3.12 |
| Immigrants | Austria | 0.0 /100 | #321 | Tragic 3.12 |
| Immigrants | Canada | 0.0 /100 | #322 | Tragic 3.12 |
| Soviet Union | 0.0 /100 | #323 | Tragic 3.11 |
| Celtics | 0.0 /100 | #324 | Tragic 3.11 |
| English | 0.0 /100 | #325 | Tragic 3.11 |
| Ottawa | 0.0 /100 | #326 | Tragic 3.11 |