Immigrants from Sudan vs Immigrants from Cambodia Average Family Size
COMPARE
Immigrants from Sudan
Immigrants from Cambodia
Average Family Size
Average Family Size Comparison
Immigrants from Sudan
Immigrants from Cambodia
3.22
AVERAGE FAMILY SIZE
29.1/ 100
METRIC RATING
194th/ 347
METRIC RANK
3.33
AVERAGE FAMILY SIZE
99.9/ 100
METRIC RATING
68th/ 347
METRIC RANK
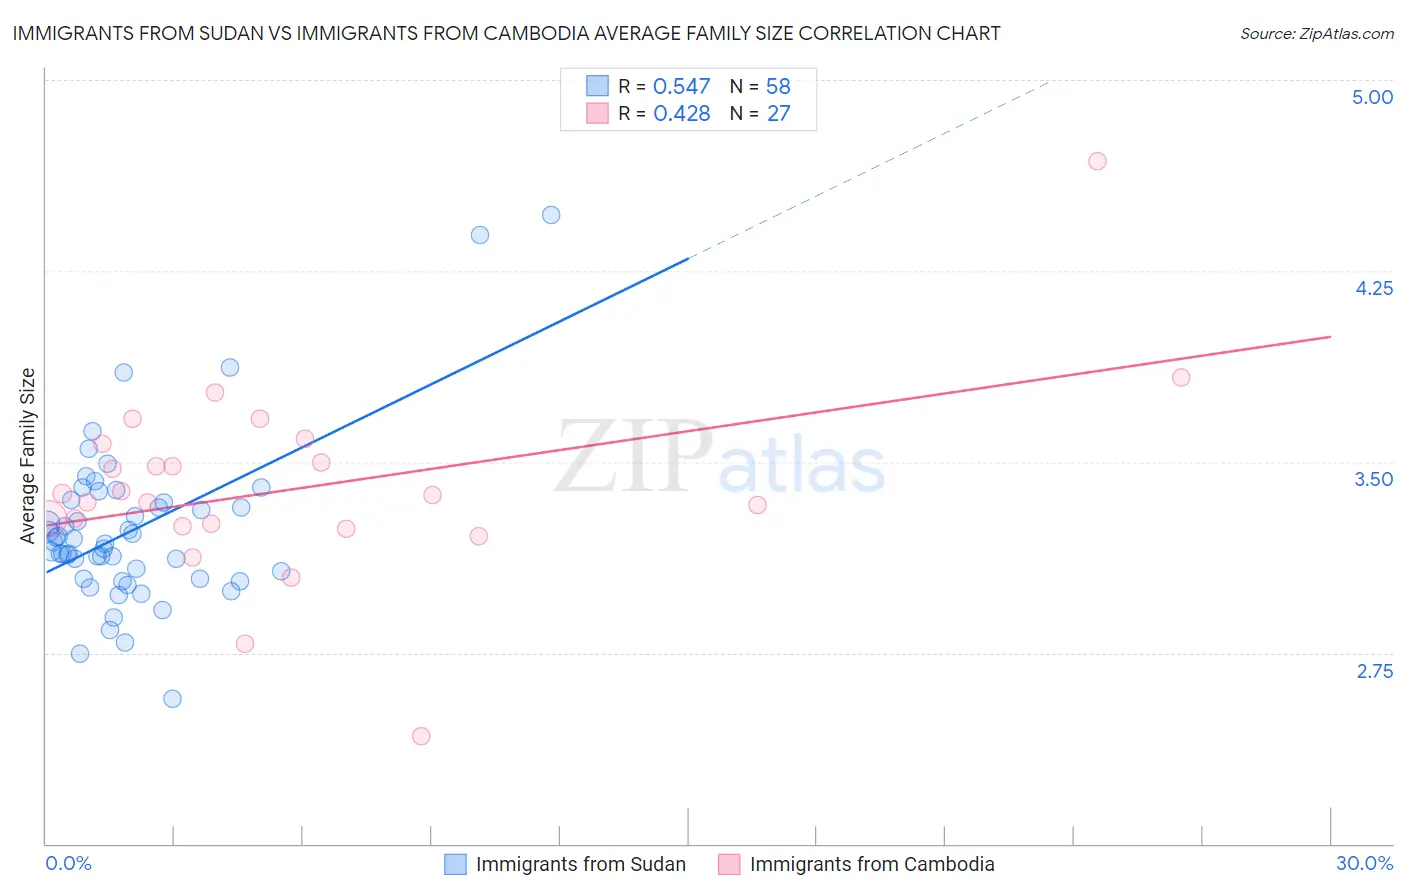
Immigrants from Sudan vs Immigrants from Cambodia Average Family Size Correlation Chart
The statistical analysis conducted on geographies consisting of 118,946,972 people shows a substantial positive correlation between the proportion of Immigrants from Sudan and average family size in the United States with a correlation coefficient (R) of 0.547 and weighted average of 3.22. Similarly, the statistical analysis conducted on geographies consisting of 205,129,465 people shows a moderate positive correlation between the proportion of Immigrants from Cambodia and average family size in the United States with a correlation coefficient (R) of 0.428 and weighted average of 3.33, a difference of 3.6%.
Average Family Size Correlation Summary
| Measurement | Immigrants from Sudan | Immigrants from Cambodia |
| Minimum | 2.57 | 2.42 |
| Maximum | 4.47 | 4.68 |
| Range | 1.90 | 2.26 |
| Mean | 3.23 | 3.40 |
| Median | 3.18 | 3.37 |
| Interquartile 25% (IQ1) | 3.04 | 3.25 |
| Interquartile 75% (IQ3) | 3.34 | 3.57 |
| Interquartile Range (IQR) | 0.30 | 0.32 |
| Standard Deviation (Sample) | 0.33 | 0.39 |
| Standard Deviation (Population) | 0.32 | 0.38 |
Similar Demographics by Average Family Size
Demographics Similar to Immigrants from Sudan by Average Family Size
In terms of average family size, the demographic groups most similar to Immigrants from Sudan are Immigrants from Israel (3.22, a difference of 0.0%), Immigrants from Eastern Africa (3.22, a difference of 0.020%), Choctaw (3.21, a difference of 0.020%), Senegalese (3.21, a difference of 0.020%), and Kenyan (3.21, a difference of 0.020%).
| Demographics | Rating | Rank | Average Family Size |
| Immigrants | Malaysia | 39.0 /100 | #187 | Fair 3.22 |
| Thais | 38.3 /100 | #188 | Fair 3.22 |
| Pakistanis | 33.7 /100 | #189 | Fair 3.22 |
| Burmese | 31.0 /100 | #190 | Fair 3.22 |
| Immigrants | Zaire | 30.5 /100 | #191 | Fair 3.22 |
| Immigrants | Eastern Africa | 30.1 /100 | #192 | Fair 3.22 |
| Immigrants | Israel | 29.3 /100 | #193 | Fair 3.22 |
| Immigrants | Sudan | 29.1 /100 | #194 | Fair 3.22 |
| Choctaw | 28.3 /100 | #195 | Fair 3.21 |
| Senegalese | 28.2 /100 | #196 | Fair 3.21 |
| Kenyans | 28.0 /100 | #197 | Fair 3.21 |
| Immigrants | Azores | 21.7 /100 | #198 | Fair 3.21 |
| Hmong | 20.7 /100 | #199 | Fair 3.21 |
| Immigrants | Kenya | 19.2 /100 | #200 | Poor 3.21 |
| Immigrants | Morocco | 18.5 /100 | #201 | Poor 3.21 |
Demographics Similar to Immigrants from Cambodia by Average Family Size
In terms of average family size, the demographic groups most similar to Immigrants from Cambodia are Immigrants (3.33, a difference of 0.030%), Immigrants from Jamaica (3.33, a difference of 0.080%), Immigrants from Trinidad and Tobago (3.33, a difference of 0.080%), Immigrants from West Indies (3.33, a difference of 0.090%), and Immigrants from St. Vincent and the Grenadines (3.34, a difference of 0.12%).
| Demographics | Rating | Rank | Average Family Size |
| Central American Indians | 100.0 /100 | #61 | Exceptional 3.35 |
| Immigrants | Grenada | 100.0 /100 | #62 | Exceptional 3.34 |
| Chinese | 100.0 /100 | #63 | Exceptional 3.34 |
| Dominicans | 99.9 /100 | #64 | Exceptional 3.34 |
| Immigrants | Laos | 99.9 /100 | #65 | Exceptional 3.34 |
| Immigrants | St. Vincent and the Grenadines | 99.9 /100 | #66 | Exceptional 3.34 |
| Immigrants | Jamaica | 99.9 /100 | #67 | Exceptional 3.33 |
| Immigrants | Cambodia | 99.9 /100 | #68 | Exceptional 3.33 |
| Immigrants | Immigrants | 99.9 /100 | #69 | Exceptional 3.33 |
| Immigrants | Trinidad and Tobago | 99.9 /100 | #70 | Exceptional 3.33 |
| Immigrants | West Indies | 99.9 /100 | #71 | Exceptional 3.33 |
| Immigrants | Caribbean | 99.9 /100 | #72 | Exceptional 3.33 |
| Yaqui | 99.9 /100 | #73 | Exceptional 3.32 |
| Immigrants | Sierra Leone | 99.9 /100 | #74 | Exceptional 3.32 |
| Immigrants | Barbados | 99.8 /100 | #75 | Exceptional 3.32 |