Immigrants from Eastern Asia vs Immigrants from Cambodia Average Family Size
COMPARE
Immigrants from Eastern Asia
Immigrants from Cambodia
Average Family Size
Average Family Size Comparison
Immigrants from Eastern Asia
Immigrants from Cambodia
3.22
AVERAGE FAMILY SIZE
40.8/ 100
METRIC RATING
184th/ 347
METRIC RANK
3.33
AVERAGE FAMILY SIZE
99.9/ 100
METRIC RATING
68th/ 347
METRIC RANK
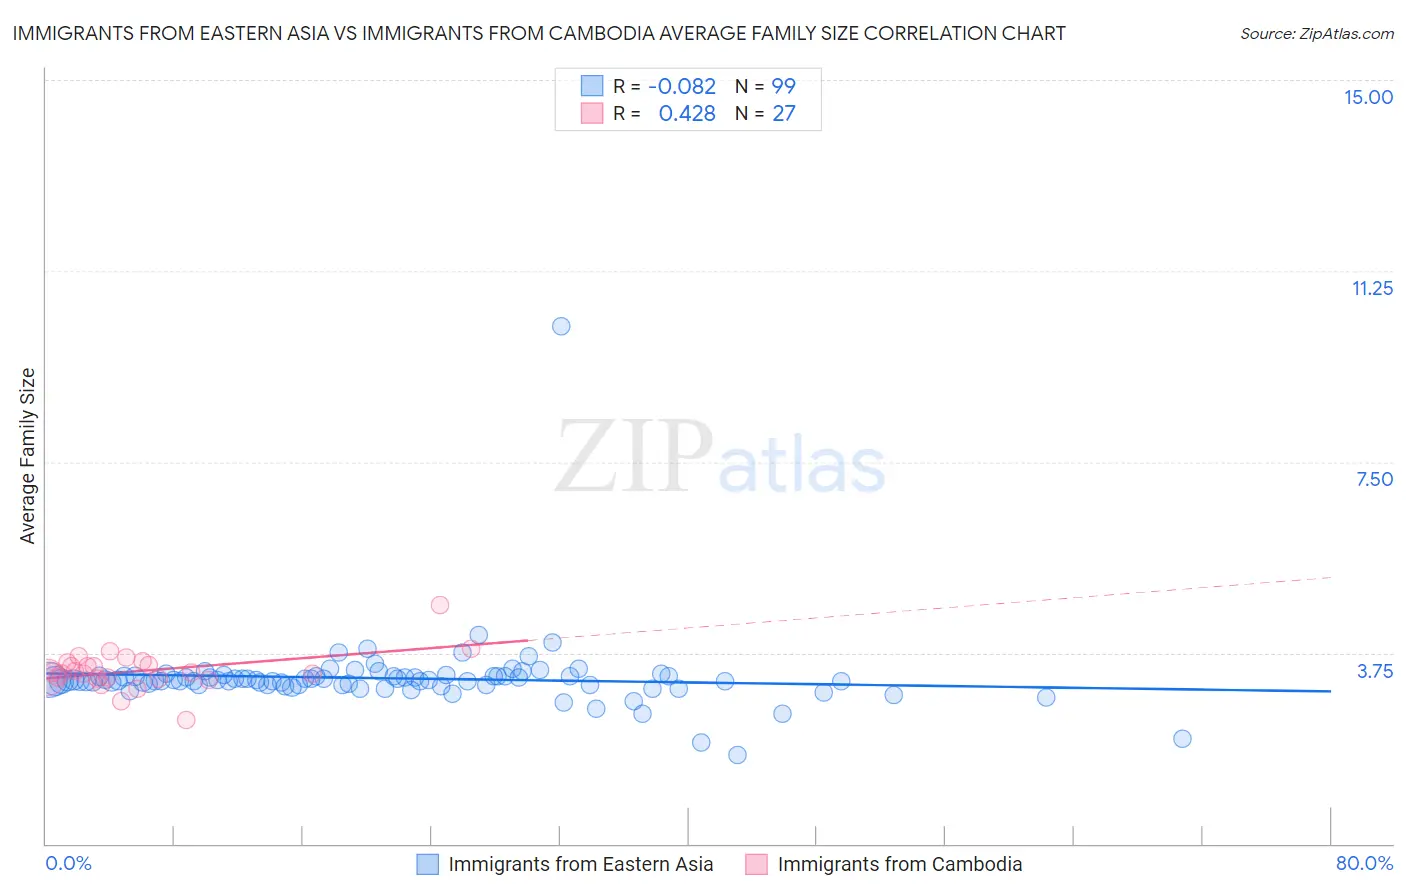
Immigrants from Eastern Asia vs Immigrants from Cambodia Average Family Size Correlation Chart
The statistical analysis conducted on geographies consisting of 499,398,667 people shows a slight negative correlation between the proportion of Immigrants from Eastern Asia and average family size in the United States with a correlation coefficient (R) of -0.082 and weighted average of 3.22. Similarly, the statistical analysis conducted on geographies consisting of 205,129,465 people shows a moderate positive correlation between the proportion of Immigrants from Cambodia and average family size in the United States with a correlation coefficient (R) of 0.428 and weighted average of 3.33, a difference of 3.4%.
Average Family Size Correlation Summary
| Measurement | Immigrants from Eastern Asia | Immigrants from Cambodia |
| Minimum | 1.75 | 2.42 |
| Maximum | 10.17 | 4.68 |
| Range | 8.42 | 2.26 |
| Mean | 3.25 | 3.40 |
| Median | 3.21 | 3.37 |
| Interquartile 25% (IQ1) | 3.12 | 3.25 |
| Interquartile 75% (IQ3) | 3.29 | 3.57 |
| Interquartile Range (IQR) | 0.17 | 0.32 |
| Standard Deviation (Sample) | 0.77 | 0.39 |
| Standard Deviation (Population) | 0.77 | 0.38 |
Similar Demographics by Average Family Size
Demographics Similar to Immigrants from Eastern Asia by Average Family Size
In terms of average family size, the demographic groups most similar to Immigrants from Eastern Asia are Immigrants from Northern Africa (3.22, a difference of 0.020%), Immigrants from Sri Lanka (3.22, a difference of 0.020%), Immigrants from Argentina (3.22, a difference of 0.020%), Immigrants from Malaysia (3.22, a difference of 0.030%), and Thai (3.22, a difference of 0.050%).
| Demographics | Rating | Rank | Average Family Size |
| Argentineans | 47.4 /100 | #177 | Average 3.23 |
| Spaniards | 47.2 /100 | #178 | Average 3.23 |
| Immigrants | Korea | 46.9 /100 | #179 | Average 3.23 |
| Palestinians | 46.6 /100 | #180 | Average 3.23 |
| Spanish | 44.8 /100 | #181 | Average 3.23 |
| Moroccans | 44.2 /100 | #182 | Average 3.22 |
| Immigrants | Northern Africa | 41.7 /100 | #183 | Average 3.22 |
| Immigrants | Eastern Asia | 40.8 /100 | #184 | Average 3.22 |
| Immigrants | Sri Lanka | 39.8 /100 | #185 | Fair 3.22 |
| Immigrants | Argentina | 39.8 /100 | #186 | Fair 3.22 |
| Immigrants | Malaysia | 39.0 /100 | #187 | Fair 3.22 |
| Thais | 38.3 /100 | #188 | Fair 3.22 |
| Pakistanis | 33.7 /100 | #189 | Fair 3.22 |
| Burmese | 31.0 /100 | #190 | Fair 3.22 |
| Immigrants | Zaire | 30.5 /100 | #191 | Fair 3.22 |
Demographics Similar to Immigrants from Cambodia by Average Family Size
In terms of average family size, the demographic groups most similar to Immigrants from Cambodia are Immigrants (3.33, a difference of 0.030%), Immigrants from Jamaica (3.33, a difference of 0.080%), Immigrants from Trinidad and Tobago (3.33, a difference of 0.080%), Immigrants from West Indies (3.33, a difference of 0.090%), and Immigrants from St. Vincent and the Grenadines (3.34, a difference of 0.12%).
| Demographics | Rating | Rank | Average Family Size |
| Central American Indians | 100.0 /100 | #61 | Exceptional 3.35 |
| Immigrants | Grenada | 100.0 /100 | #62 | Exceptional 3.34 |
| Chinese | 100.0 /100 | #63 | Exceptional 3.34 |
| Dominicans | 99.9 /100 | #64 | Exceptional 3.34 |
| Immigrants | Laos | 99.9 /100 | #65 | Exceptional 3.34 |
| Immigrants | St. Vincent and the Grenadines | 99.9 /100 | #66 | Exceptional 3.34 |
| Immigrants | Jamaica | 99.9 /100 | #67 | Exceptional 3.33 |
| Immigrants | Cambodia | 99.9 /100 | #68 | Exceptional 3.33 |
| Immigrants | Immigrants | 99.9 /100 | #69 | Exceptional 3.33 |
| Immigrants | Trinidad and Tobago | 99.9 /100 | #70 | Exceptional 3.33 |
| Immigrants | West Indies | 99.9 /100 | #71 | Exceptional 3.33 |
| Immigrants | Caribbean | 99.9 /100 | #72 | Exceptional 3.33 |
| Yaqui | 99.9 /100 | #73 | Exceptional 3.32 |
| Immigrants | Sierra Leone | 99.9 /100 | #74 | Exceptional 3.32 |
| Immigrants | Barbados | 99.8 /100 | #75 | Exceptional 3.32 |