Palestinian vs Immigrants from Cambodia Average Family Size
COMPARE
Palestinian
Immigrants from Cambodia
Average Family Size
Average Family Size Comparison
Palestinians
Immigrants from Cambodia
3.23
AVERAGE FAMILY SIZE
46.6/ 100
METRIC RATING
180th/ 347
METRIC RANK
3.33
AVERAGE FAMILY SIZE
99.9/ 100
METRIC RATING
68th/ 347
METRIC RANK
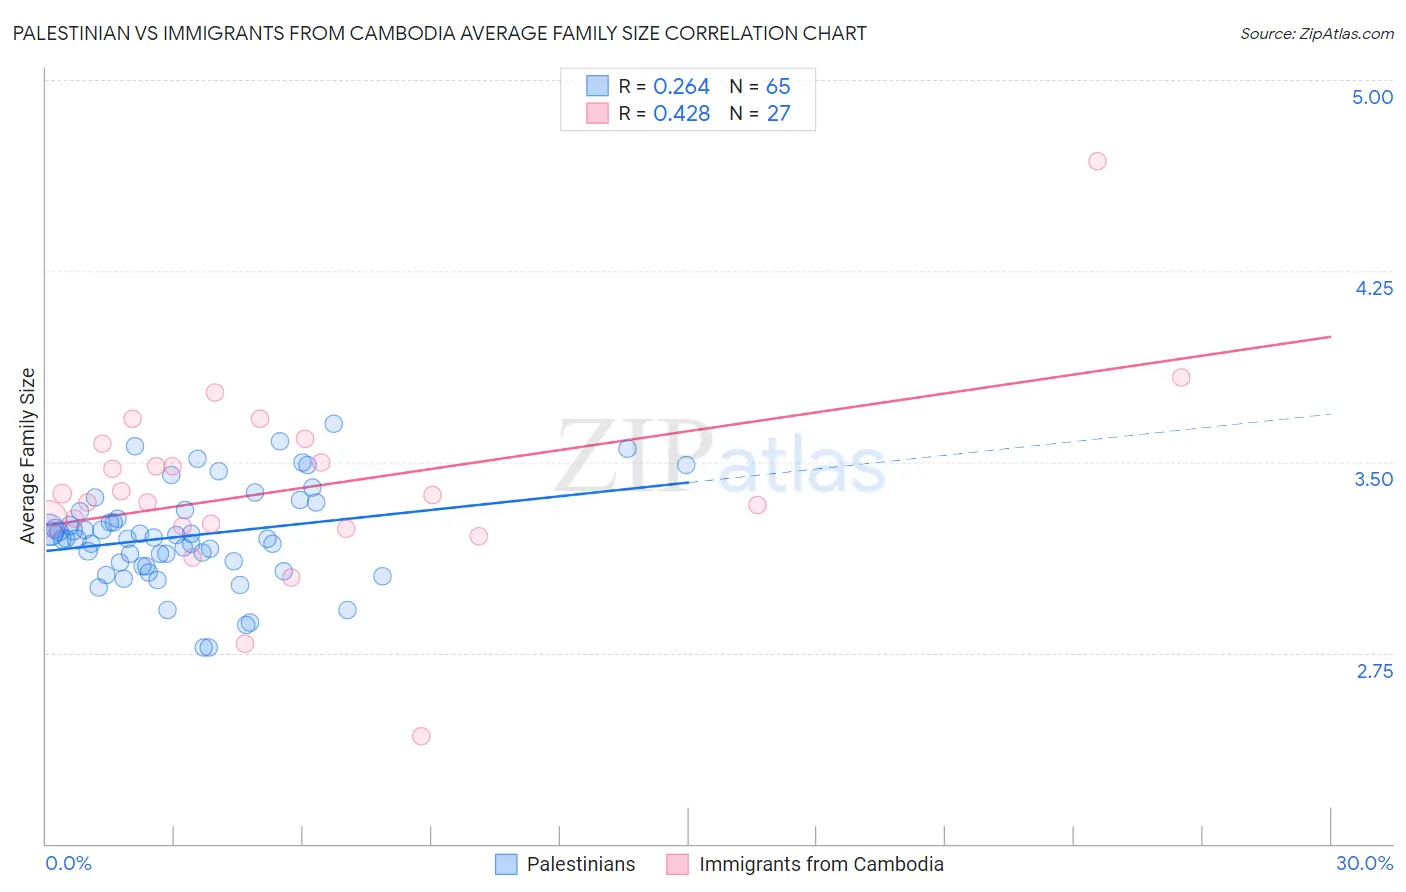
Palestinian vs Immigrants from Cambodia Average Family Size Correlation Chart
The statistical analysis conducted on geographies consisting of 216,402,658 people shows a weak positive correlation between the proportion of Palestinians and average family size in the United States with a correlation coefficient (R) of 0.264 and weighted average of 3.23. Similarly, the statistical analysis conducted on geographies consisting of 205,129,465 people shows a moderate positive correlation between the proportion of Immigrants from Cambodia and average family size in the United States with a correlation coefficient (R) of 0.428 and weighted average of 3.33, a difference of 3.3%.
Average Family Size Correlation Summary
| Measurement | Palestinian | Immigrants from Cambodia |
| Minimum | 2.77 | 2.42 |
| Maximum | 3.65 | 4.68 |
| Range | 0.88 | 2.26 |
| Mean | 3.21 | 3.40 |
| Median | 3.20 | 3.37 |
| Interquartile 25% (IQ1) | 3.10 | 3.25 |
| Interquartile 75% (IQ3) | 3.31 | 3.57 |
| Interquartile Range (IQR) | 0.21 | 0.32 |
| Standard Deviation (Sample) | 0.19 | 0.39 |
| Standard Deviation (Population) | 0.19 | 0.38 |
Similar Demographics by Average Family Size
Demographics Similar to Palestinians by Average Family Size
In terms of average family size, the demographic groups most similar to Palestinians are Argentinean (3.23, a difference of 0.010%), Spaniard (3.23, a difference of 0.010%), Immigrants from Korea (3.23, a difference of 0.010%), Spanish (3.23, a difference of 0.030%), and Israeli (3.23, a difference of 0.040%).
| Demographics | Rating | Rank | Average Family Size |
| Immigrants | Uruguay | 52.0 /100 | #173 | Average 3.23 |
| Immigrants | South Central Asia | 50.0 /100 | #174 | Average 3.23 |
| Immigrants | China | 49.9 /100 | #175 | Average 3.23 |
| Israelis | 48.7 /100 | #176 | Average 3.23 |
| Argentineans | 47.4 /100 | #177 | Average 3.23 |
| Spaniards | 47.2 /100 | #178 | Average 3.23 |
| Immigrants | Korea | 46.9 /100 | #179 | Average 3.23 |
| Palestinians | 46.6 /100 | #180 | Average 3.23 |
| Spanish | 44.8 /100 | #181 | Average 3.23 |
| Moroccans | 44.2 /100 | #182 | Average 3.22 |
| Immigrants | Northern Africa | 41.7 /100 | #183 | Average 3.22 |
| Immigrants | Eastern Asia | 40.8 /100 | #184 | Average 3.22 |
| Immigrants | Sri Lanka | 39.8 /100 | #185 | Fair 3.22 |
| Immigrants | Argentina | 39.8 /100 | #186 | Fair 3.22 |
| Immigrants | Malaysia | 39.0 /100 | #187 | Fair 3.22 |
Demographics Similar to Immigrants from Cambodia by Average Family Size
In terms of average family size, the demographic groups most similar to Immigrants from Cambodia are Immigrants (3.33, a difference of 0.030%), Immigrants from Jamaica (3.33, a difference of 0.080%), Immigrants from Trinidad and Tobago (3.33, a difference of 0.080%), Immigrants from West Indies (3.33, a difference of 0.090%), and Immigrants from St. Vincent and the Grenadines (3.34, a difference of 0.12%).
| Demographics | Rating | Rank | Average Family Size |
| Central American Indians | 100.0 /100 | #61 | Exceptional 3.35 |
| Immigrants | Grenada | 100.0 /100 | #62 | Exceptional 3.34 |
| Chinese | 100.0 /100 | #63 | Exceptional 3.34 |
| Dominicans | 99.9 /100 | #64 | Exceptional 3.34 |
| Immigrants | Laos | 99.9 /100 | #65 | Exceptional 3.34 |
| Immigrants | St. Vincent and the Grenadines | 99.9 /100 | #66 | Exceptional 3.34 |
| Immigrants | Jamaica | 99.9 /100 | #67 | Exceptional 3.33 |
| Immigrants | Cambodia | 99.9 /100 | #68 | Exceptional 3.33 |
| Immigrants | Immigrants | 99.9 /100 | #69 | Exceptional 3.33 |
| Immigrants | Trinidad and Tobago | 99.9 /100 | #70 | Exceptional 3.33 |
| Immigrants | West Indies | 99.9 /100 | #71 | Exceptional 3.33 |
| Immigrants | Caribbean | 99.9 /100 | #72 | Exceptional 3.33 |
| Yaqui | 99.9 /100 | #73 | Exceptional 3.32 |
| Immigrants | Sierra Leone | 99.9 /100 | #74 | Exceptional 3.32 |
| Immigrants | Barbados | 99.8 /100 | #75 | Exceptional 3.32 |