Mexican vs Mexican American Indian Average Family Size
COMPARE
Mexican
Mexican American Indian
Average Family Size
Average Family Size Comparison
Mexicans
Mexican American Indians
3.48
AVERAGE FAMILY SIZE
100.0/ 100
METRIC RATING
19th/ 347
METRIC RANK
3.43
AVERAGE FAMILY SIZE
100.0/ 100
METRIC RATING
27th/ 347
METRIC RANK
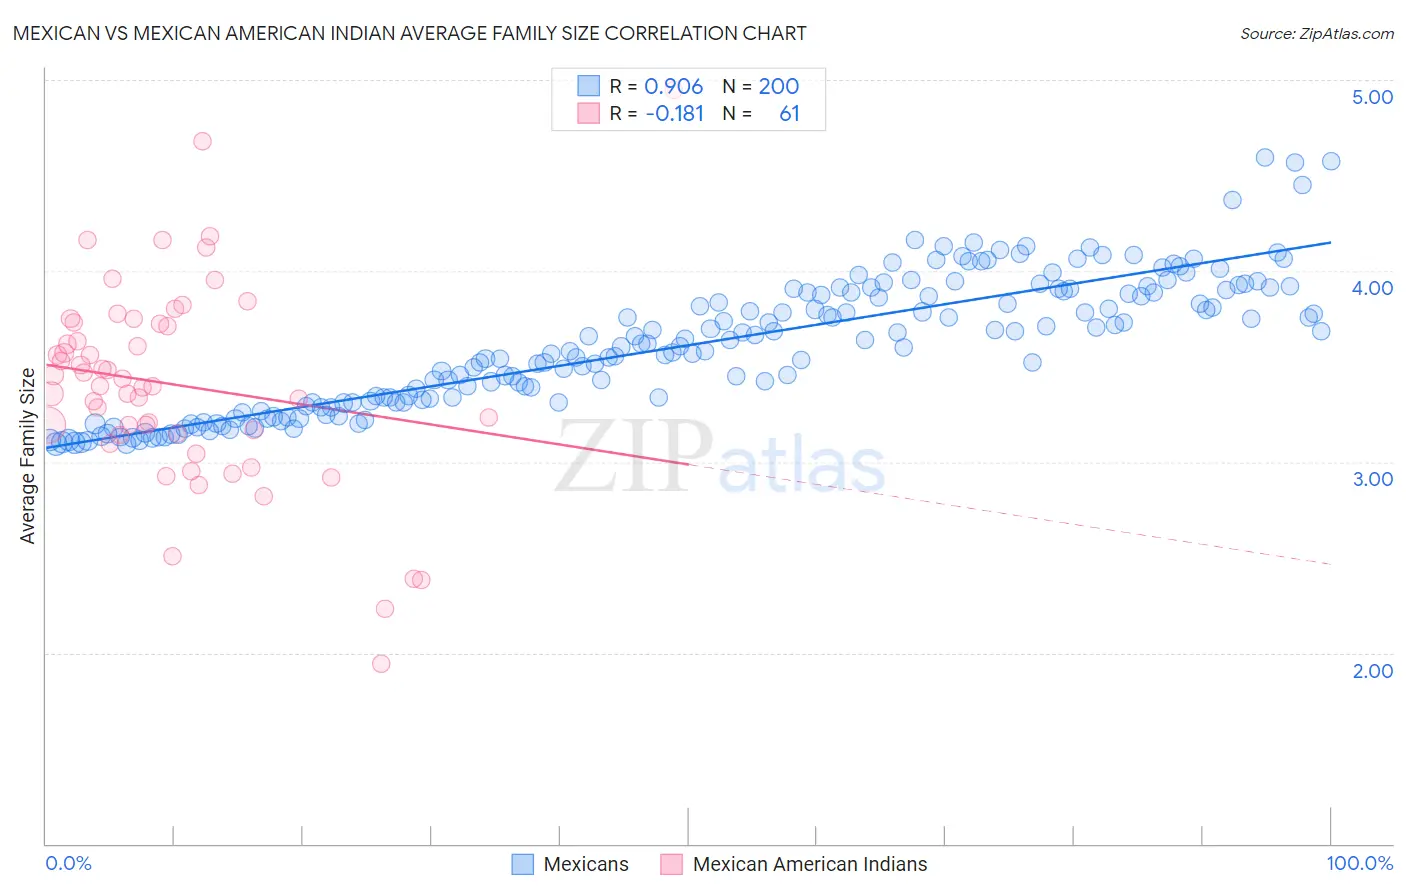
Mexican vs Mexican American Indian Average Family Size Correlation Chart
The statistical analysis conducted on geographies consisting of 564,667,700 people shows a near-perfect positive correlation between the proportion of Mexicans and average family size in the United States with a correlation coefficient (R) of 0.906 and weighted average of 3.48. Similarly, the statistical analysis conducted on geographies consisting of 317,496,069 people shows a poor negative correlation between the proportion of Mexican American Indians and average family size in the United States with a correlation coefficient (R) of -0.181 and weighted average of 3.43, a difference of 1.4%.
Average Family Size Correlation Summary
| Measurement | Mexican | Mexican American Indian |
| Minimum | 3.09 | 1.94 |
| Maximum | 4.59 | 4.95 |
| Range | 1.50 | 3.01 |
| Mean | 3.61 | 3.40 |
| Median | 3.60 | 3.40 |
| Interquartile 25% (IQ1) | 3.31 | 3.15 |
| Interquartile 75% (IQ3) | 3.89 | 3.73 |
| Interquartile Range (IQR) | 0.58 | 0.58 |
| Standard Deviation (Sample) | 0.34 | 0.53 |
| Standard Deviation (Population) | 0.34 | 0.53 |
Demographics Similar to Mexicans and Mexican American Indians by Average Family Size
In terms of average family size, the demographic groups most similar to Mexicans are Cheyenne (3.47, a difference of 0.040%), Salvadoran (3.48, a difference of 0.070%), Yuman (3.47, a difference of 0.30%), Immigrants from El Salvador (3.49, a difference of 0.32%), and Apache (3.46, a difference of 0.35%). Similarly, the demographic groups most similar to Mexican American Indians are Native Hawaiian (3.43, a difference of 0.010%), Immigrants from Latin America (3.42, a difference of 0.12%), Nepalese (3.42, a difference of 0.21%), Samoan (3.42, a difference of 0.24%), and Central American (3.41, a difference of 0.44%).
| Demographics | Rating | Rank | Average Family Size |
| Sioux | 100.0 /100 | #13 | Exceptional 3.52 |
| Immigrants | Central America | 100.0 /100 | #14 | Exceptional 3.49 |
| Tongans | 100.0 /100 | #15 | Exceptional 3.49 |
| Ute | 100.0 /100 | #16 | Exceptional 3.49 |
| Immigrants | El Salvador | 100.0 /100 | #17 | Exceptional 3.49 |
| Salvadorans | 100.0 /100 | #18 | Exceptional 3.48 |
| Mexicans | 100.0 /100 | #19 | Exceptional 3.48 |
| Cheyenne | 100.0 /100 | #20 | Exceptional 3.47 |
| Yuman | 100.0 /100 | #21 | Exceptional 3.47 |
| Apache | 100.0 /100 | #22 | Exceptional 3.46 |
| Immigrants | Fiji | 100.0 /100 | #23 | Exceptional 3.45 |
| Natives/Alaskans | 100.0 /100 | #24 | Exceptional 3.45 |
| Yakama | 100.0 /100 | #25 | Exceptional 3.45 |
| Native Hawaiians | 100.0 /100 | #26 | Exceptional 3.43 |
| Mexican American Indians | 100.0 /100 | #27 | Exceptional 3.43 |
| Immigrants | Latin America | 100.0 /100 | #28 | Exceptional 3.42 |
| Nepalese | 100.0 /100 | #29 | Exceptional 3.42 |
| Samoans | 100.0 /100 | #30 | Exceptional 3.42 |
| Central Americans | 100.0 /100 | #31 | Exceptional 3.41 |
| Immigrants | Guatemala | 100.0 /100 | #32 | Exceptional 3.41 |
| Hawaiians | 100.0 /100 | #33 | Exceptional 3.41 |