Mexican vs Japanese Average Family Size
COMPARE
Mexican
Japanese
Average Family Size
Average Family Size Comparison
Mexicans
Japanese
3.48
AVERAGE FAMILY SIZE
100.0/ 100
METRIC RATING
19th/ 347
METRIC RANK
3.35
AVERAGE FAMILY SIZE
100.0/ 100
METRIC RATING
59th/ 347
METRIC RANK
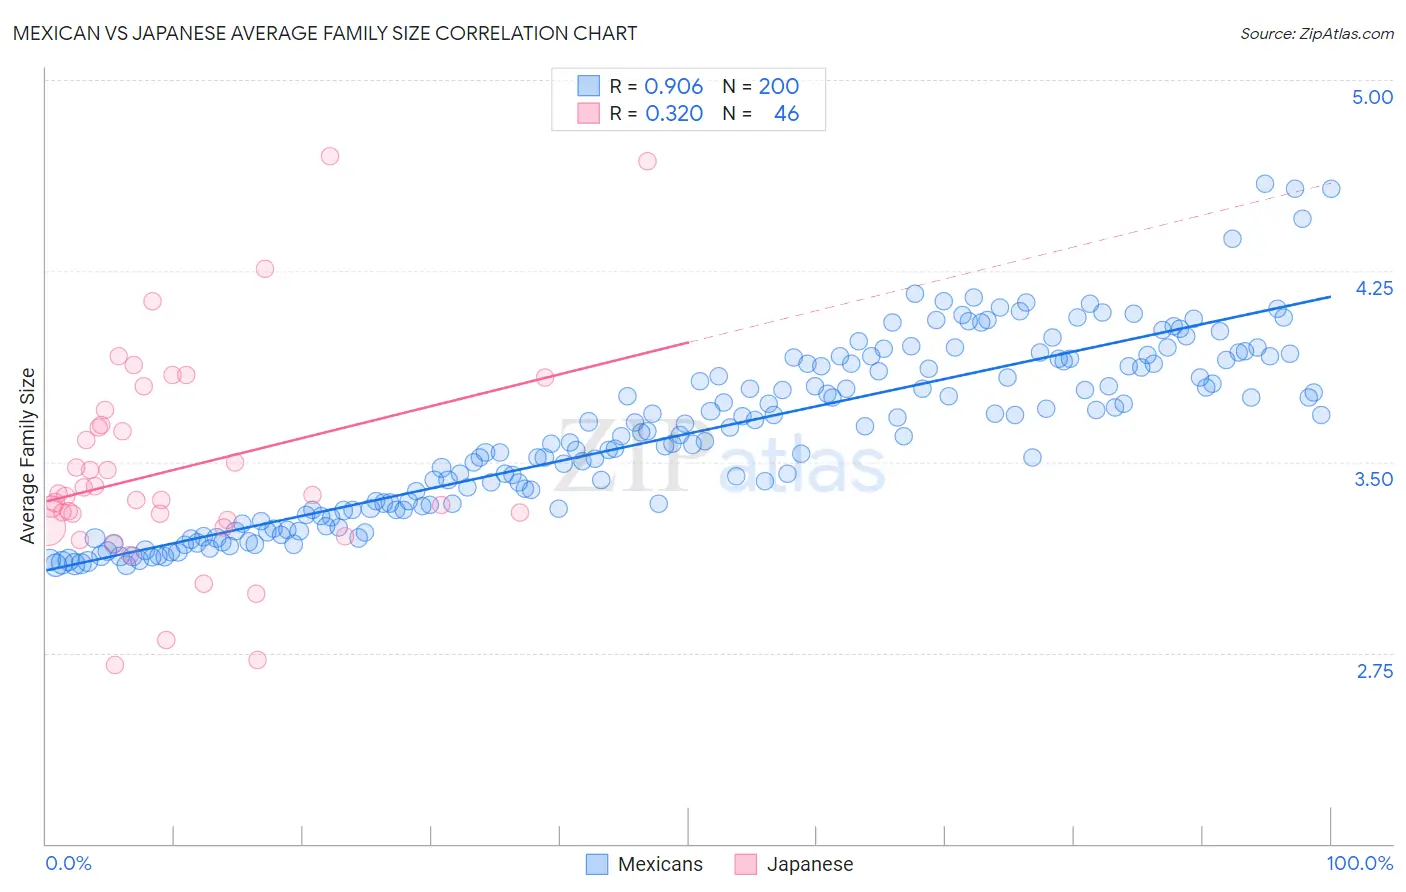
Mexican vs Japanese Average Family Size Correlation Chart
The statistical analysis conducted on geographies consisting of 564,667,700 people shows a near-perfect positive correlation between the proportion of Mexicans and average family size in the United States with a correlation coefficient (R) of 0.906 and weighted average of 3.48. Similarly, the statistical analysis conducted on geographies consisting of 249,073,483 people shows a mild positive correlation between the proportion of Japanese and average family size in the United States with a correlation coefficient (R) of 0.320 and weighted average of 3.35, a difference of 3.8%.
Average Family Size Correlation Summary
| Measurement | Mexican | Japanese |
| Minimum | 3.09 | 2.70 |
| Maximum | 4.59 | 4.70 |
| Range | 1.50 | 2.00 |
| Mean | 3.61 | 3.47 |
| Median | 3.60 | 3.37 |
| Interquartile 25% (IQ1) | 3.31 | 3.27 |
| Interquartile 75% (IQ3) | 3.89 | 3.65 |
| Interquartile Range (IQR) | 0.58 | 0.38 |
| Standard Deviation (Sample) | 0.34 | 0.42 |
| Standard Deviation (Population) | 0.34 | 0.41 |
Similar Demographics by Average Family Size
Demographics Similar to Mexicans by Average Family Size
In terms of average family size, the demographic groups most similar to Mexicans are Cheyenne (3.47, a difference of 0.040%), Salvadoran (3.48, a difference of 0.070%), Yuman (3.47, a difference of 0.30%), Immigrants from El Salvador (3.49, a difference of 0.32%), and Apache (3.46, a difference of 0.35%).
| Demographics | Rating | Rank | Average Family Size |
| Immigrants | Mexico | 100.0 /100 | #12 | Exceptional 3.52 |
| Sioux | 100.0 /100 | #13 | Exceptional 3.52 |
| Immigrants | Central America | 100.0 /100 | #14 | Exceptional 3.49 |
| Tongans | 100.0 /100 | #15 | Exceptional 3.49 |
| Ute | 100.0 /100 | #16 | Exceptional 3.49 |
| Immigrants | El Salvador | 100.0 /100 | #17 | Exceptional 3.49 |
| Salvadorans | 100.0 /100 | #18 | Exceptional 3.48 |
| Mexicans | 100.0 /100 | #19 | Exceptional 3.48 |
| Cheyenne | 100.0 /100 | #20 | Exceptional 3.47 |
| Yuman | 100.0 /100 | #21 | Exceptional 3.47 |
| Apache | 100.0 /100 | #22 | Exceptional 3.46 |
| Immigrants | Fiji | 100.0 /100 | #23 | Exceptional 3.45 |
| Natives/Alaskans | 100.0 /100 | #24 | Exceptional 3.45 |
| Yakama | 100.0 /100 | #25 | Exceptional 3.45 |
| Native Hawaiians | 100.0 /100 | #26 | Exceptional 3.43 |
Demographics Similar to Japanese by Average Family Size
In terms of average family size, the demographic groups most similar to Japanese are Immigrants from Armenia (3.35, a difference of 0.020%), Central American Indian (3.35, a difference of 0.050%), Honduran (3.35, a difference of 0.090%), Sri Lankan (3.35, a difference of 0.10%), and Immigrants from Dominican Republic (3.35, a difference of 0.15%).
| Demographics | Rating | Rank | Average Family Size |
| Fijians | 100.0 /100 | #52 | Exceptional 3.36 |
| Koreans | 100.0 /100 | #53 | Exceptional 3.36 |
| Immigrants | South Eastern Asia | 100.0 /100 | #54 | Exceptional 3.36 |
| Immigrants | Honduras | 100.0 /100 | #55 | Exceptional 3.36 |
| Immigrants | Dominican Republic | 100.0 /100 | #56 | Exceptional 3.35 |
| Sri Lankans | 100.0 /100 | #57 | Exceptional 3.35 |
| Hondurans | 100.0 /100 | #58 | Exceptional 3.35 |
| Japanese | 100.0 /100 | #59 | Exceptional 3.35 |
| Immigrants | Armenia | 100.0 /100 | #60 | Exceptional 3.35 |
| Central American Indians | 100.0 /100 | #61 | Exceptional 3.35 |
| Immigrants | Grenada | 100.0 /100 | #62 | Exceptional 3.34 |
| Chinese | 100.0 /100 | #63 | Exceptional 3.34 |
| Dominicans | 99.9 /100 | #64 | Exceptional 3.34 |
| Immigrants | Laos | 99.9 /100 | #65 | Exceptional 3.34 |
| Immigrants | St. Vincent and the Grenadines | 99.9 /100 | #66 | Exceptional 3.34 |