Immigrants from El Salvador vs Slavic Average Family Size
COMPARE
Immigrants from El Salvador
Slavic
Average Family Size
Average Family Size Comparison
Immigrants from El Salvador
Slavs
3.49
AVERAGE FAMILY SIZE
100.0/ 100
METRIC RATING
17th/ 347
METRIC RANK
3.13
AVERAGE FAMILY SIZE
0.1/ 100
METRIC RATING
308th/ 347
METRIC RANK
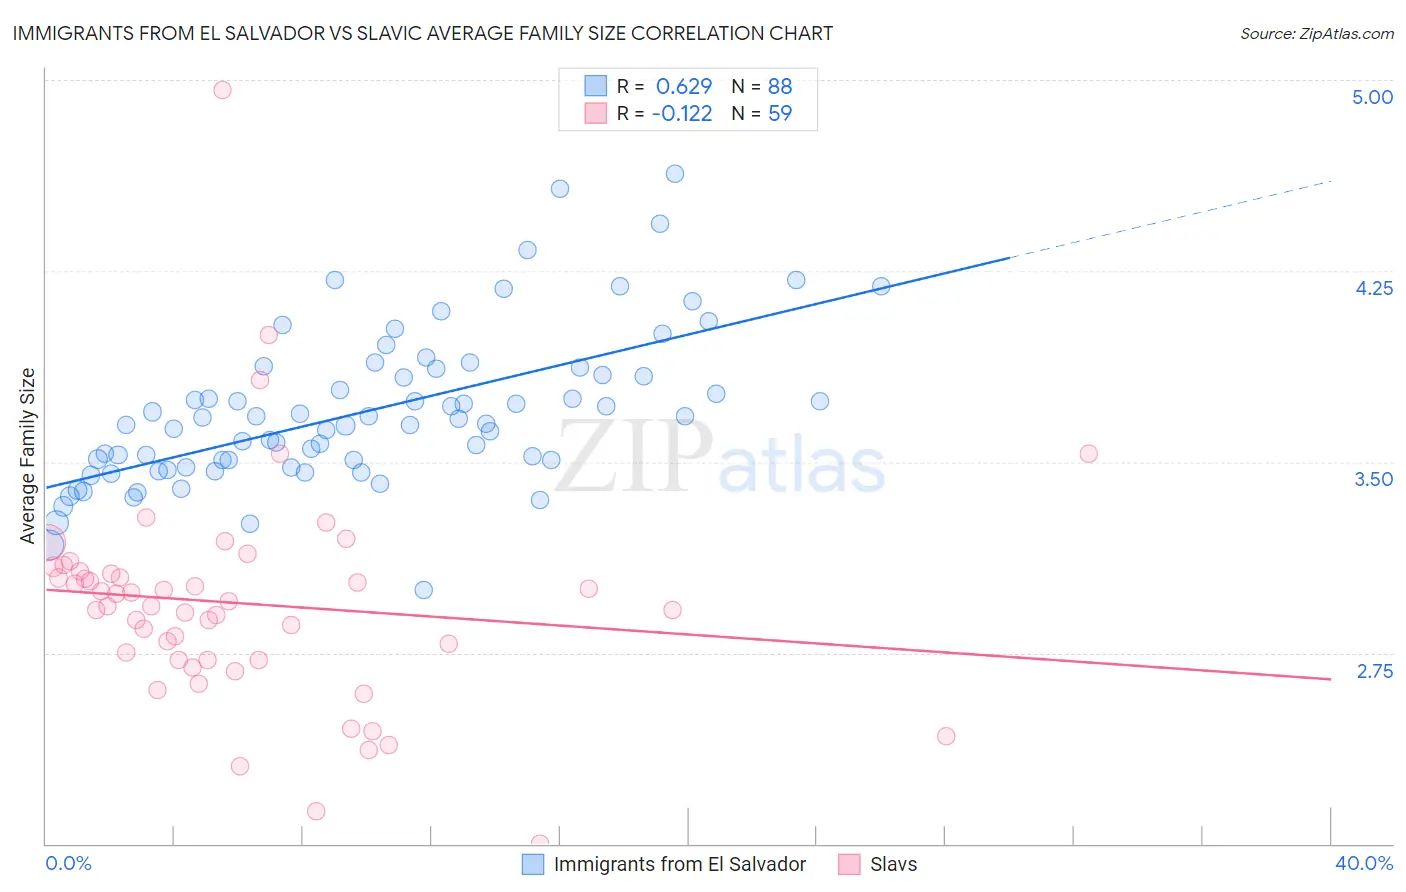
Immigrants from El Salvador vs Slavic Average Family Size Correlation Chart
The statistical analysis conducted on geographies consisting of 357,696,345 people shows a significant positive correlation between the proportion of Immigrants from El Salvador and average family size in the United States with a correlation coefficient (R) of 0.629 and weighted average of 3.49. Similarly, the statistical analysis conducted on geographies consisting of 270,815,552 people shows a poor negative correlation between the proportion of Slavs and average family size in the United States with a correlation coefficient (R) of -0.122 and weighted average of 3.13, a difference of 11.5%.
Average Family Size Correlation Summary
| Measurement | Immigrants from El Salvador | Slavic |
| Minimum | 3.00 | 2.00 |
| Maximum | 4.63 | 4.96 |
| Range | 1.63 | 2.96 |
| Mean | 3.70 | 2.94 |
| Median | 3.66 | 2.93 |
| Interquartile 25% (IQ1) | 3.49 | 2.72 |
| Interquartile 75% (IQ3) | 3.85 | 3.07 |
| Interquartile Range (IQR) | 0.36 | 0.35 |
| Standard Deviation (Sample) | 0.30 | 0.44 |
| Standard Deviation (Population) | 0.30 | 0.44 |
Similar Demographics by Average Family Size
Demographics Similar to Immigrants from El Salvador by Average Family Size
In terms of average family size, the demographic groups most similar to Immigrants from El Salvador are Ute (3.49, a difference of 0.090%), Tongan (3.49, a difference of 0.15%), Immigrants from Central America (3.49, a difference of 0.19%), Salvadoran (3.48, a difference of 0.25%), and Mexican (3.48, a difference of 0.32%).
| Demographics | Rating | Rank | Average Family Size |
| Spanish American Indians | 100.0 /100 | #10 | Exceptional 3.58 |
| Tohono O'odham | 100.0 /100 | #11 | Exceptional 3.53 |
| Immigrants | Mexico | 100.0 /100 | #12 | Exceptional 3.52 |
| Sioux | 100.0 /100 | #13 | Exceptional 3.52 |
| Immigrants | Central America | 100.0 /100 | #14 | Exceptional 3.49 |
| Tongans | 100.0 /100 | #15 | Exceptional 3.49 |
| Ute | 100.0 /100 | #16 | Exceptional 3.49 |
| Immigrants | El Salvador | 100.0 /100 | #17 | Exceptional 3.49 |
| Salvadorans | 100.0 /100 | #18 | Exceptional 3.48 |
| Mexicans | 100.0 /100 | #19 | Exceptional 3.48 |
| Cheyenne | 100.0 /100 | #20 | Exceptional 3.47 |
| Yuman | 100.0 /100 | #21 | Exceptional 3.47 |
| Apache | 100.0 /100 | #22 | Exceptional 3.46 |
| Immigrants | Fiji | 100.0 /100 | #23 | Exceptional 3.45 |
| Natives/Alaskans | 100.0 /100 | #24 | Exceptional 3.45 |
Demographics Similar to Slavs by Average Family Size
In terms of average family size, the demographic groups most similar to Slavs are Northern European (3.13, a difference of 0.010%), Czechoslovakian (3.13, a difference of 0.030%), Immigrants from Serbia (3.13, a difference of 0.050%), Immigrants from Ireland (3.13, a difference of 0.060%), and Immigrants from Northern Europe (3.13, a difference of 0.070%).
| Demographics | Rating | Rank | Average Family Size |
| Macedonians | 0.2 /100 | #301 | Tragic 3.13 |
| Immigrants | Latvia | 0.2 /100 | #302 | Tragic 3.13 |
| British | 0.2 /100 | #303 | Tragic 3.13 |
| Immigrants | Switzerland | 0.2 /100 | #304 | Tragic 3.13 |
| Australians | 0.1 /100 | #305 | Tragic 3.13 |
| Immigrants | Ireland | 0.1 /100 | #306 | Tragic 3.13 |
| Immigrants | Serbia | 0.1 /100 | #307 | Tragic 3.13 |
| Slavs | 0.1 /100 | #308 | Tragic 3.13 |
| Northern Europeans | 0.1 /100 | #309 | Tragic 3.13 |
| Czechoslovakians | 0.1 /100 | #310 | Tragic 3.13 |
| Immigrants | Northern Europe | 0.1 /100 | #311 | Tragic 3.13 |
| Immigrants | Australia | 0.1 /100 | #312 | Tragic 3.13 |
| Bulgarians | 0.1 /100 | #313 | Tragic 3.13 |
| Russians | 0.1 /100 | #314 | Tragic 3.12 |
| Immigrants | Scotland | 0.1 /100 | #315 | Tragic 3.12 |