Somali vs Slavic Average Family Size
COMPARE
Somali
Slavic
Average Family Size
Average Family Size Comparison
Somalis
Slavs
3.20
AVERAGE FAMILY SIZE
11.2/ 100
METRIC RATING
214th/ 347
METRIC RANK
3.13
AVERAGE FAMILY SIZE
0.1/ 100
METRIC RATING
308th/ 347
METRIC RANK
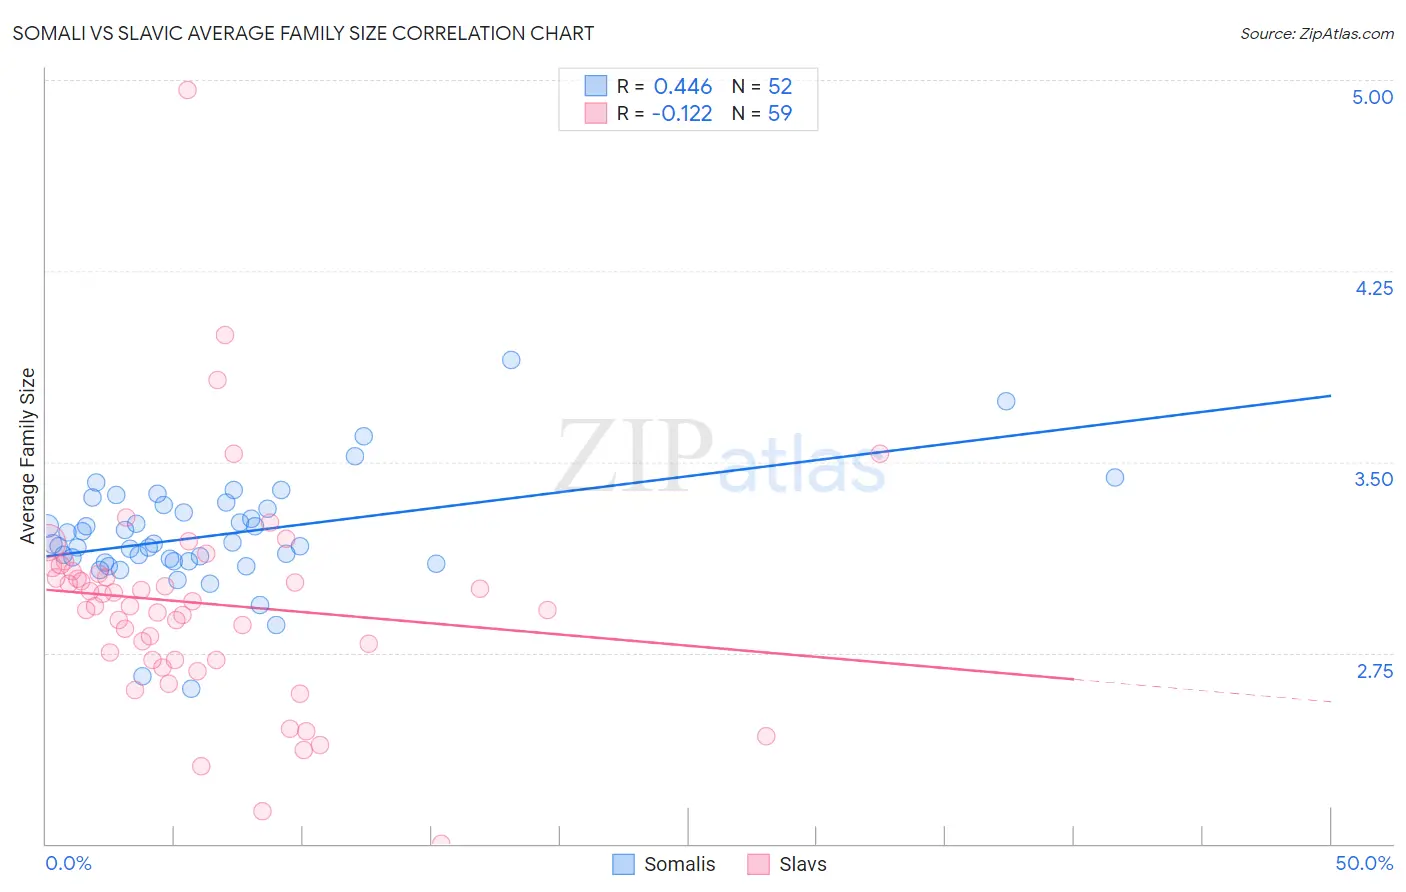
Somali vs Slavic Average Family Size Correlation Chart
The statistical analysis conducted on geographies consisting of 99,260,153 people shows a moderate positive correlation between the proportion of Somalis and average family size in the United States with a correlation coefficient (R) of 0.446 and weighted average of 3.20. Similarly, the statistical analysis conducted on geographies consisting of 270,815,552 people shows a poor negative correlation between the proportion of Slavs and average family size in the United States with a correlation coefficient (R) of -0.122 and weighted average of 3.13, a difference of 2.2%.
Average Family Size Correlation Summary
| Measurement | Somali | Slavic |
| Minimum | 2.61 | 2.00 |
| Maximum | 3.90 | 4.96 |
| Range | 1.29 | 2.96 |
| Mean | 3.21 | 2.94 |
| Median | 3.18 | 2.93 |
| Interquartile 25% (IQ1) | 3.11 | 2.72 |
| Interquartile 75% (IQ3) | 3.32 | 3.07 |
| Interquartile Range (IQR) | 0.21 | 0.35 |
| Standard Deviation (Sample) | 0.22 | 0.44 |
| Standard Deviation (Population) | 0.21 | 0.44 |
Similar Demographics by Average Family Size
Demographics Similar to Somalis by Average Family Size
In terms of average family size, the demographic groups most similar to Somalis are Delaware (3.20, a difference of 0.010%), Bermudan (3.20, a difference of 0.010%), Mongolian (3.20, a difference of 0.020%), Immigrants from Iran (3.20, a difference of 0.040%), and Creek (3.20, a difference of 0.040%).
| Demographics | Rating | Rank | Average Family Size |
| Filipinos | 13.6 /100 | #207 | Poor 3.20 |
| Chippewa | 13.3 /100 | #208 | Poor 3.20 |
| Sudanese | 13.3 /100 | #209 | Poor 3.20 |
| Zimbabweans | 12.6 /100 | #210 | Poor 3.20 |
| Immigrants | Iran | 12.1 /100 | #211 | Poor 3.20 |
| Creek | 12.1 /100 | #212 | Poor 3.20 |
| Mongolians | 11.5 /100 | #213 | Poor 3.20 |
| Somalis | 11.2 /100 | #214 | Poor 3.20 |
| Delaware | 11.1 /100 | #215 | Poor 3.20 |
| Bermudans | 11.0 /100 | #216 | Poor 3.20 |
| Immigrants | Somalia | 10.3 /100 | #217 | Poor 3.20 |
| French American Indians | 9.8 /100 | #218 | Tragic 3.20 |
| Pennsylvania Germans | 9.3 /100 | #219 | Tragic 3.19 |
| Lebanese | 9.1 /100 | #220 | Tragic 3.19 |
| Immigrants | Ukraine | 7.2 /100 | #221 | Tragic 3.19 |
Demographics Similar to Slavs by Average Family Size
In terms of average family size, the demographic groups most similar to Slavs are Northern European (3.13, a difference of 0.010%), Czechoslovakian (3.13, a difference of 0.030%), Immigrants from Serbia (3.13, a difference of 0.050%), Immigrants from Ireland (3.13, a difference of 0.060%), and Immigrants from Northern Europe (3.13, a difference of 0.070%).
| Demographics | Rating | Rank | Average Family Size |
| Macedonians | 0.2 /100 | #301 | Tragic 3.13 |
| Immigrants | Latvia | 0.2 /100 | #302 | Tragic 3.13 |
| British | 0.2 /100 | #303 | Tragic 3.13 |
| Immigrants | Switzerland | 0.2 /100 | #304 | Tragic 3.13 |
| Australians | 0.1 /100 | #305 | Tragic 3.13 |
| Immigrants | Ireland | 0.1 /100 | #306 | Tragic 3.13 |
| Immigrants | Serbia | 0.1 /100 | #307 | Tragic 3.13 |
| Slavs | 0.1 /100 | #308 | Tragic 3.13 |
| Northern Europeans | 0.1 /100 | #309 | Tragic 3.13 |
| Czechoslovakians | 0.1 /100 | #310 | Tragic 3.13 |
| Immigrants | Northern Europe | 0.1 /100 | #311 | Tragic 3.13 |
| Immigrants | Australia | 0.1 /100 | #312 | Tragic 3.13 |
| Bulgarians | 0.1 /100 | #313 | Tragic 3.13 |
| Russians | 0.1 /100 | #314 | Tragic 3.12 |
| Immigrants | Scotland | 0.1 /100 | #315 | Tragic 3.12 |