Pima vs Slavic Average Family Size
COMPARE
Pima
Slavic
Average Family Size
Average Family Size Comparison
Pima
Slavs
3.75
AVERAGE FAMILY SIZE
100/ 100
METRIC RATING
4th/ 347
METRIC RANK
3.13
AVERAGE FAMILY SIZE
0.1/ 100
METRIC RATING
308th/ 347
METRIC RANK
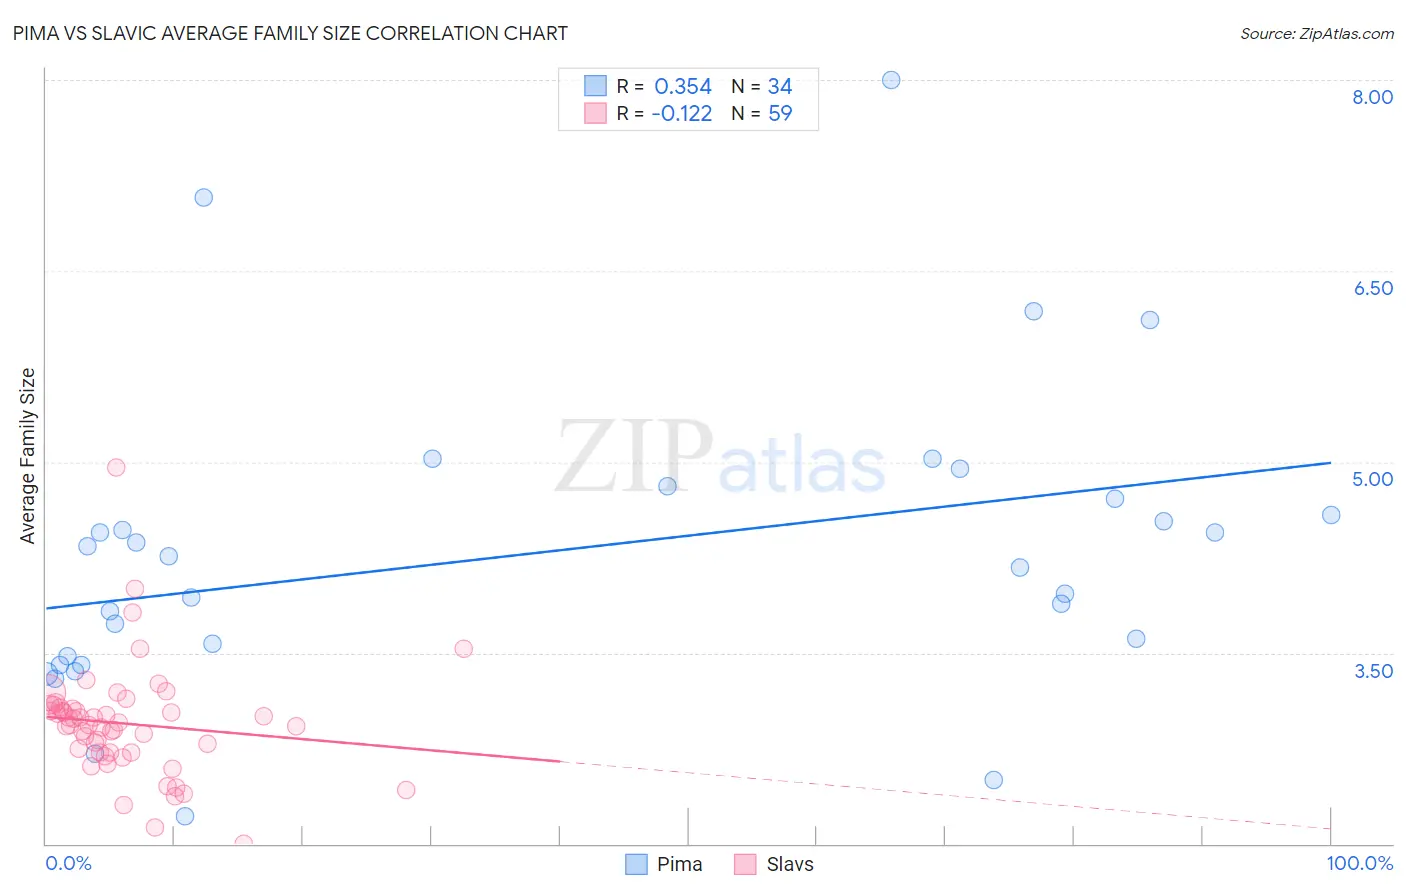
Pima vs Slavic Average Family Size Correlation Chart
The statistical analysis conducted on geographies consisting of 61,539,566 people shows a mild positive correlation between the proportion of Pima and average family size in the United States with a correlation coefficient (R) of 0.354 and weighted average of 3.75. Similarly, the statistical analysis conducted on geographies consisting of 270,815,552 people shows a poor negative correlation between the proportion of Slavs and average family size in the United States with a correlation coefficient (R) of -0.122 and weighted average of 3.13, a difference of 19.8%.
Average Family Size Correlation Summary
| Measurement | Pima | Slavic |
| Minimum | 2.22 | 2.00 |
| Maximum | 8.00 | 4.96 |
| Range | 5.78 | 2.96 |
| Mean | 4.29 | 2.94 |
| Median | 4.21 | 2.93 |
| Interquartile 25% (IQ1) | 3.48 | 2.72 |
| Interquartile 75% (IQ3) | 4.71 | 3.07 |
| Interquartile Range (IQR) | 1.23 | 0.35 |
| Standard Deviation (Sample) | 1.20 | 0.44 |
| Standard Deviation (Population) | 1.18 | 0.44 |
Similar Demographics by Average Family Size
Demographics Similar to Pima by Average Family Size
In terms of average family size, the demographic groups most similar to Pima are Pueblo (3.79, a difference of 1.3%), Crow (3.82, a difference of 2.1%), Navajo (3.65, a difference of 2.8%), Arapaho (3.64, a difference of 3.1%), and Inupiat (3.63, a difference of 3.3%).
| Demographics | Rating | Rank | Average Family Size |
| Yup'ik | 100 /100 | #1 | Exceptional 4.00 |
| Crow | 100 /100 | #2 | Exceptional 3.82 |
| Pueblo | 100 /100 | #3 | Exceptional 3.79 |
| Pima | 100 /100 | #4 | Exceptional 3.75 |
| Navajo | 100.0 /100 | #5 | Exceptional 3.65 |
| Arapaho | 100.0 /100 | #6 | Exceptional 3.64 |
| Inupiat | 100.0 /100 | #7 | Exceptional 3.63 |
| Immigrants | Yemen | 100.0 /100 | #8 | Exceptional 3.60 |
| Hopi | 100.0 /100 | #9 | Exceptional 3.60 |
| Spanish American Indians | 100.0 /100 | #10 | Exceptional 3.58 |
| Tohono O'odham | 100.0 /100 | #11 | Exceptional 3.53 |
| Immigrants | Mexico | 100.0 /100 | #12 | Exceptional 3.52 |
| Sioux | 100.0 /100 | #13 | Exceptional 3.52 |
| Immigrants | Central America | 100.0 /100 | #14 | Exceptional 3.49 |
| Tongans | 100.0 /100 | #15 | Exceptional 3.49 |
Demographics Similar to Slavs by Average Family Size
In terms of average family size, the demographic groups most similar to Slavs are Northern European (3.13, a difference of 0.010%), Czechoslovakian (3.13, a difference of 0.030%), Immigrants from Serbia (3.13, a difference of 0.050%), Immigrants from Ireland (3.13, a difference of 0.060%), and Immigrants from Northern Europe (3.13, a difference of 0.070%).
| Demographics | Rating | Rank | Average Family Size |
| Macedonians | 0.2 /100 | #301 | Tragic 3.13 |
| Immigrants | Latvia | 0.2 /100 | #302 | Tragic 3.13 |
| British | 0.2 /100 | #303 | Tragic 3.13 |
| Immigrants | Switzerland | 0.2 /100 | #304 | Tragic 3.13 |
| Australians | 0.1 /100 | #305 | Tragic 3.13 |
| Immigrants | Ireland | 0.1 /100 | #306 | Tragic 3.13 |
| Immigrants | Serbia | 0.1 /100 | #307 | Tragic 3.13 |
| Slavs | 0.1 /100 | #308 | Tragic 3.13 |
| Northern Europeans | 0.1 /100 | #309 | Tragic 3.13 |
| Czechoslovakians | 0.1 /100 | #310 | Tragic 3.13 |
| Immigrants | Northern Europe | 0.1 /100 | #311 | Tragic 3.13 |
| Immigrants | Australia | 0.1 /100 | #312 | Tragic 3.13 |
| Bulgarians | 0.1 /100 | #313 | Tragic 3.13 |
| Russians | 0.1 /100 | #314 | Tragic 3.12 |
| Immigrants | Scotland | 0.1 /100 | #315 | Tragic 3.12 |