Swiss vs Immigrants from Canada Average Family Size
COMPARE
Swiss
Immigrants from Canada
Average Family Size
Average Family Size Comparison
Swiss
Immigrants from Canada
3.15
AVERAGE FAMILY SIZE
0.5/ 100
METRIC RATING
277th/ 347
METRIC RANK
3.12
AVERAGE FAMILY SIZE
0.0/ 100
METRIC RATING
322nd/ 347
METRIC RANK
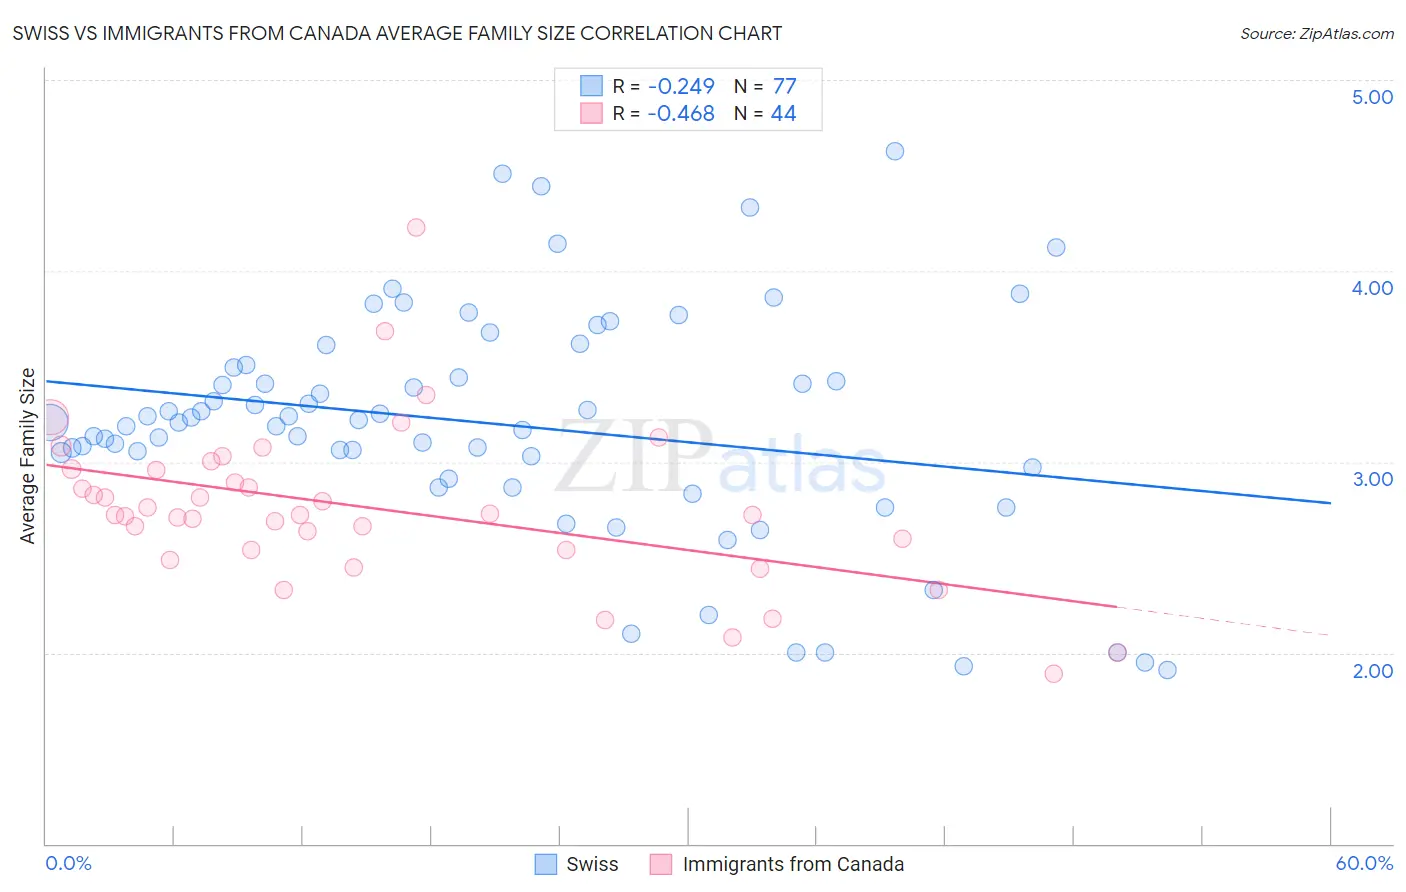
Swiss vs Immigrants from Canada Average Family Size Correlation Chart
The statistical analysis conducted on geographies consisting of 464,761,483 people shows a weak negative correlation between the proportion of Swiss and average family size in the United States with a correlation coefficient (R) of -0.249 and weighted average of 3.15. Similarly, the statistical analysis conducted on geographies consisting of 459,128,299 people shows a moderate negative correlation between the proportion of Immigrants from Canada and average family size in the United States with a correlation coefficient (R) of -0.468 and weighted average of 3.12, a difference of 1.1%.
Average Family Size Correlation Summary
| Measurement | Swiss | Immigrants from Canada |
| Minimum | 1.91 | 1.89 |
| Maximum | 4.63 | 4.23 |
| Range | 2.72 | 2.34 |
| Mean | 3.20 | 2.76 |
| Median | 3.21 | 2.72 |
| Interquartile 25% (IQ1) | 2.94 | 2.54 |
| Interquartile 75% (IQ3) | 3.50 | 2.96 |
| Interquartile Range (IQR) | 0.56 | 0.42 |
| Standard Deviation (Sample) | 0.60 | 0.42 |
| Standard Deviation (Population) | 0.60 | 0.42 |
Similar Demographics by Average Family Size
Demographics Similar to Swiss by Average Family Size
In terms of average family size, the demographic groups most similar to Swiss are Immigrants from Bosnia and Herzegovina (3.15, a difference of 0.010%), Okinawan (3.15, a difference of 0.030%), Immigrants from Europe (3.15, a difference of 0.040%), Immigrants from England (3.15, a difference of 0.070%), and New Zealander (3.15, a difference of 0.10%).
| Demographics | Rating | Rank | Average Family Size |
| Tlingit-Haida | 0.7 /100 | #270 | Tragic 3.16 |
| Immigrants | Germany | 0.7 /100 | #271 | Tragic 3.15 |
| Immigrants | Lithuania | 0.6 /100 | #272 | Tragic 3.15 |
| New Zealanders | 0.6 /100 | #273 | Tragic 3.15 |
| Immigrants | Belgium | 0.6 /100 | #274 | Tragic 3.15 |
| Cambodians | 0.6 /100 | #275 | Tragic 3.15 |
| Immigrants | Bosnia and Herzegovina | 0.5 /100 | #276 | Tragic 3.15 |
| Swiss | 0.5 /100 | #277 | Tragic 3.15 |
| Okinawans | 0.5 /100 | #278 | Tragic 3.15 |
| Immigrants | Europe | 0.5 /100 | #279 | Tragic 3.15 |
| Immigrants | England | 0.4 /100 | #280 | Tragic 3.15 |
| Immigrants | Denmark | 0.4 /100 | #281 | Tragic 3.15 |
| Yugoslavians | 0.4 /100 | #282 | Tragic 3.15 |
| German Russians | 0.4 /100 | #283 | Tragic 3.15 |
| Immigrants | France | 0.4 /100 | #284 | Tragic 3.15 |
Demographics Similar to Immigrants from Canada by Average Family Size
In terms of average family size, the demographic groups most similar to Immigrants from Canada are Immigrants from Austria (3.12, a difference of 0.0%), Immigrants from North America (3.12, a difference of 0.030%), Soviet Union (3.11, a difference of 0.030%), Eastern European (3.12, a difference of 0.11%), and Welsh (3.12, a difference of 0.11%).
| Demographics | Rating | Rank | Average Family Size |
| Immigrants | Scotland | 0.1 /100 | #315 | Tragic 3.12 |
| Serbians | 0.1 /100 | #316 | Tragic 3.12 |
| Italians | 0.1 /100 | #317 | Tragic 3.12 |
| Eastern Europeans | 0.1 /100 | #318 | Tragic 3.12 |
| Welsh | 0.1 /100 | #319 | Tragic 3.12 |
| Immigrants | North America | 0.0 /100 | #320 | Tragic 3.12 |
| Immigrants | Austria | 0.0 /100 | #321 | Tragic 3.12 |
| Immigrants | Canada | 0.0 /100 | #322 | Tragic 3.12 |
| Soviet Union | 0.0 /100 | #323 | Tragic 3.11 |
| Celtics | 0.0 /100 | #324 | Tragic 3.11 |
| English | 0.0 /100 | #325 | Tragic 3.11 |
| Ottawa | 0.0 /100 | #326 | Tragic 3.11 |
| Dutch | 0.0 /100 | #327 | Tragic 3.11 |
| Czechs | 0.0 /100 | #328 | Tragic 3.11 |
| Belgians | 0.0 /100 | #329 | Tragic 3.11 |