Marshallese vs Zimbabwean Divorced or Separated
COMPARE
Marshallese
Zimbabwean
Divorced or Separated
Divorced or Separated Comparison
Marshallese
Zimbabweans
12.0%
DIVORCED OR SEPARATED
64.6/ 100
METRIC RATING
161st/ 347
METRIC RANK
11.6%
DIVORCED OR SEPARATED
99.0/ 100
METRIC RATING
90th/ 347
METRIC RANK
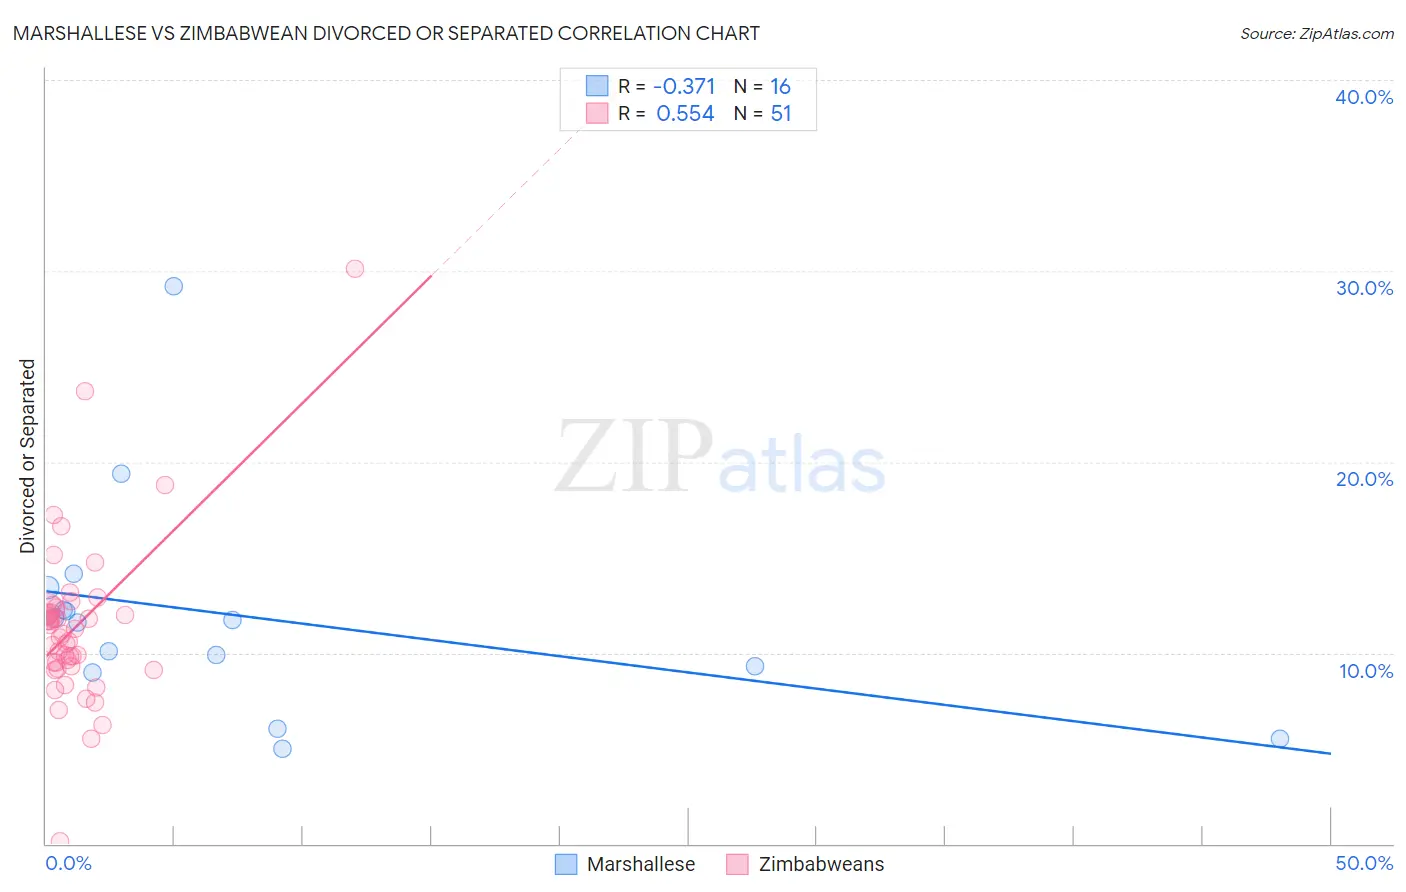
Marshallese vs Zimbabwean Divorced or Separated Correlation Chart
The statistical analysis conducted on geographies consisting of 14,761,315 people shows a mild negative correlation between the proportion of Marshallese and percentage of population currently divorced or separated in the United States with a correlation coefficient (R) of -0.371 and weighted average of 12.0%. Similarly, the statistical analysis conducted on geographies consisting of 69,193,915 people shows a substantial positive correlation between the proportion of Zimbabweans and percentage of population currently divorced or separated in the United States with a correlation coefficient (R) of 0.554 and weighted average of 11.6%, a difference of 3.6%.
Divorced or Separated Correlation Summary
| Measurement | Marshallese | Zimbabwean |
| Minimum | 5.0% | 0.10% |
| Maximum | 29.2% | 30.1% |
| Range | 24.2% | 30.0% |
| Mean | 11.9% | 11.4% |
| Median | 11.7% | 11.0% |
| Interquartile 25% (IQ1) | 9.1% | 9.3% |
| Interquartile 75% (IQ3) | 12.8% | 12.2% |
| Interquartile Range (IQR) | 3.7% | 2.9% |
| Standard Deviation (Sample) | 5.8% | 4.4% |
| Standard Deviation (Population) | 5.6% | 4.4% |
Similar Demographics by Divorced or Separated
Demographics Similar to Marshallese by Divorced or Separated
In terms of divorced or separated, the demographic groups most similar to Marshallese are Samoan (12.0%, a difference of 0.010%), Navajo (12.0%, a difference of 0.030%), Immigrants from Scotland (12.0%, a difference of 0.040%), Swiss (12.0%, a difference of 0.040%), and Immigrants from Barbados (12.0%, a difference of 0.050%).
| Demographics | Rating | Rank | Divorced or Separated |
| Chileans | 71.3 /100 | #154 | Good 12.0% |
| Japanese | 70.9 /100 | #155 | Good 12.0% |
| Hungarians | 70.3 /100 | #156 | Good 12.0% |
| Immigrants | Brazil | 68.8 /100 | #157 | Good 12.0% |
| Icelanders | 66.0 /100 | #158 | Good 12.0% |
| Immigrants | Barbados | 66.0 /100 | #159 | Good 12.0% |
| Immigrants | Scotland | 65.8 /100 | #160 | Good 12.0% |
| Marshallese | 64.6 /100 | #161 | Good 12.0% |
| Samoans | 64.3 /100 | #162 | Good 12.0% |
| Navajo | 63.9 /100 | #163 | Good 12.0% |
| Swiss | 63.6 /100 | #164 | Good 12.0% |
| German Russians | 61.8 /100 | #165 | Good 12.0% |
| Tohono O'odham | 60.4 /100 | #166 | Good 12.0% |
| Ethiopians | 58.5 /100 | #167 | Average 12.0% |
| Serbians | 57.1 /100 | #168 | Average 12.0% |
Demographics Similar to Zimbabweans by Divorced or Separated
In terms of divorced or separated, the demographic groups most similar to Zimbabweans are Spanish American Indian (11.6%, a difference of 0.040%), Immigrants from Southern Europe (11.6%, a difference of 0.10%), Immigrants from Denmark (11.6%, a difference of 0.10%), Arab (11.6%, a difference of 0.10%), and Immigrants from Fiji (11.6%, a difference of 0.11%).
| Demographics | Rating | Rank | Divorced or Separated |
| Immigrants | Bulgaria | 99.3 /100 | #83 | Exceptional 11.5% |
| Bulgarians | 99.3 /100 | #84 | Exceptional 11.5% |
| Immigrants | Albania | 99.3 /100 | #85 | Exceptional 11.5% |
| Immigrants | Latvia | 99.2 /100 | #86 | Exceptional 11.6% |
| Immigrants | Nepal | 99.2 /100 | #87 | Exceptional 11.6% |
| Immigrants | Europe | 99.2 /100 | #88 | Exceptional 11.6% |
| Immigrants | Southern Europe | 99.1 /100 | #89 | Exceptional 11.6% |
| Zimbabweans | 99.0 /100 | #90 | Exceptional 11.6% |
| Spanish American Indians | 99.0 /100 | #91 | Exceptional 11.6% |
| Immigrants | Denmark | 98.9 /100 | #92 | Exceptional 11.6% |
| Arabs | 98.9 /100 | #93 | Exceptional 11.6% |
| Immigrants | Fiji | 98.9 /100 | #94 | Exceptional 11.6% |
| Immigrants | Serbia | 98.8 /100 | #95 | Exceptional 11.6% |
| Immigrants | Ukraine | 98.7 /100 | #96 | Exceptional 11.6% |
| Latvians | 98.7 /100 | #97 | Exceptional 11.6% |