Guyanese vs Zimbabwean Divorced or Separated
COMPARE
Guyanese
Zimbabwean
Divorced or Separated
Divorced or Separated Comparison
Guyanese
Zimbabweans
11.5%
DIVORCED OR SEPARATED
99.4/ 100
METRIC RATING
79th/ 347
METRIC RANK
11.6%
DIVORCED OR SEPARATED
99.0/ 100
METRIC RATING
90th/ 347
METRIC RANK
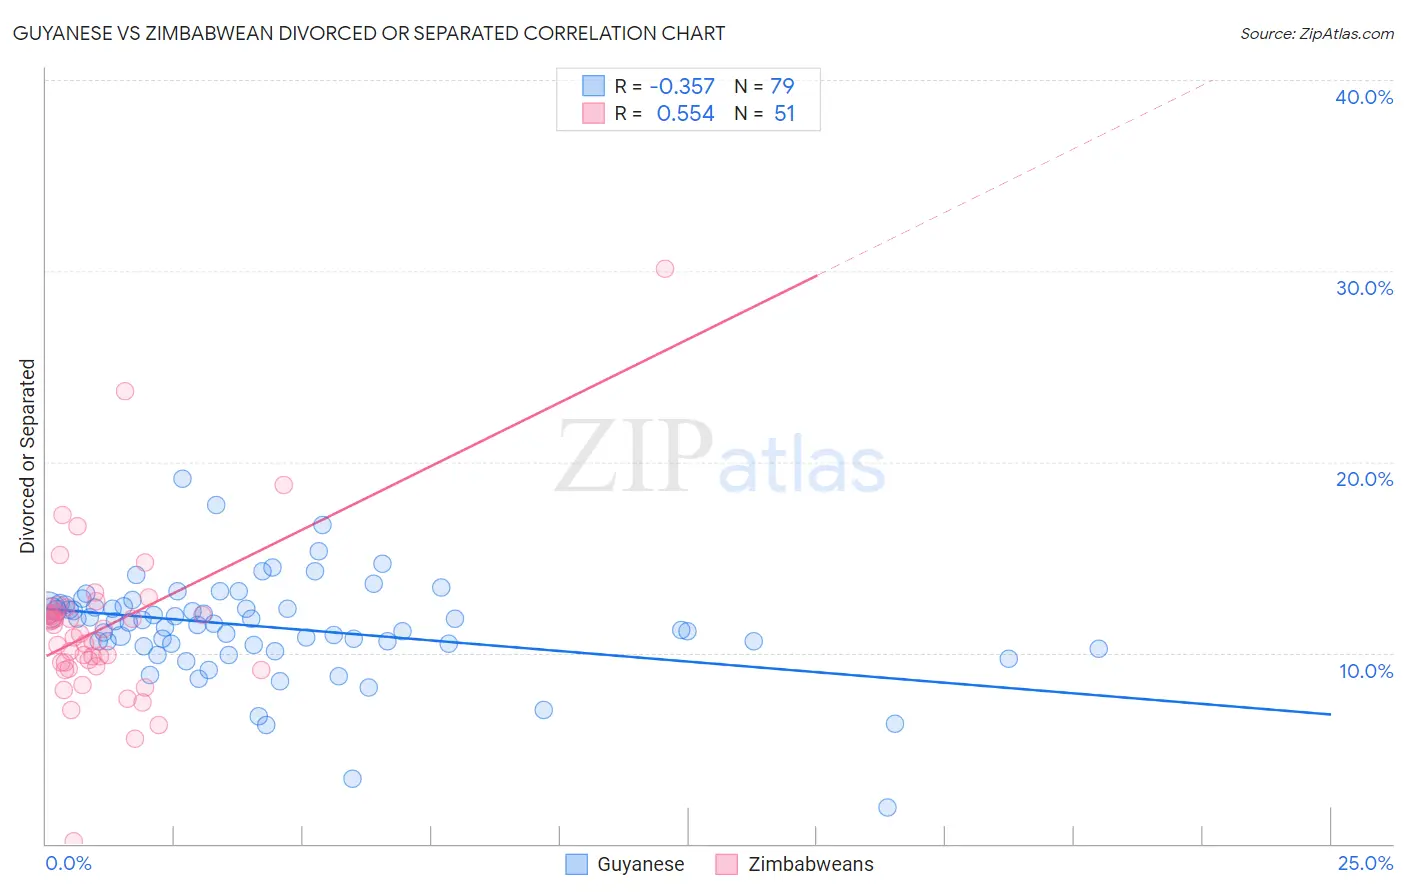
Guyanese vs Zimbabwean Divorced or Separated Correlation Chart
The statistical analysis conducted on geographies consisting of 176,825,728 people shows a mild negative correlation between the proportion of Guyanese and percentage of population currently divorced or separated in the United States with a correlation coefficient (R) of -0.357 and weighted average of 11.5%. Similarly, the statistical analysis conducted on geographies consisting of 69,193,915 people shows a substantial positive correlation between the proportion of Zimbabweans and percentage of population currently divorced or separated in the United States with a correlation coefficient (R) of 0.554 and weighted average of 11.6%, a difference of 0.48%.
Divorced or Separated Correlation Summary
| Measurement | Guyanese | Zimbabwean |
| Minimum | 1.9% | 0.10% |
| Maximum | 19.1% | 30.1% |
| Range | 17.2% | 30.0% |
| Mean | 11.3% | 11.4% |
| Median | 11.6% | 11.0% |
| Interquartile 25% (IQ1) | 10.4% | 9.3% |
| Interquartile 75% (IQ3) | 12.5% | 12.2% |
| Interquartile Range (IQR) | 2.1% | 2.9% |
| Standard Deviation (Sample) | 2.6% | 4.4% |
| Standard Deviation (Population) | 2.6% | 4.4% |
Demographics Similar to Guyanese and Zimbabweans by Divorced or Separated
In terms of divorced or separated, the demographic groups most similar to Guyanese are Immigrants from Switzerland (11.5%, a difference of 0.020%), Russian (11.5%, a difference of 0.030%), Afghan (11.5%, a difference of 0.040%), Immigrants from Romania (11.5%, a difference of 0.11%), and Immigrants from Italy (11.5%, a difference of 0.14%). Similarly, the demographic groups most similar to Zimbabweans are Spanish American Indian (11.6%, a difference of 0.040%), Immigrants from Southern Europe (11.6%, a difference of 0.10%), Immigrants from Denmark (11.6%, a difference of 0.10%), Arab (11.6%, a difference of 0.10%), and Immigrants from Fiji (11.6%, a difference of 0.11%).
| Demographics | Rating | Rank | Divorced or Separated |
| Taiwanese | 99.6 /100 | #74 | Exceptional 11.5% |
| Immigrants | Northern Africa | 99.6 /100 | #75 | Exceptional 11.5% |
| Albanians | 99.6 /100 | #76 | Exceptional 11.5% |
| Immigrants | Italy | 99.5 /100 | #77 | Exceptional 11.5% |
| Afghans | 99.4 /100 | #78 | Exceptional 11.5% |
| Guyanese | 99.4 /100 | #79 | Exceptional 11.5% |
| Immigrants | Switzerland | 99.4 /100 | #80 | Exceptional 11.5% |
| Russians | 99.4 /100 | #81 | Exceptional 11.5% |
| Immigrants | Romania | 99.3 /100 | #82 | Exceptional 11.5% |
| Immigrants | Bulgaria | 99.3 /100 | #83 | Exceptional 11.5% |
| Bulgarians | 99.3 /100 | #84 | Exceptional 11.5% |
| Immigrants | Albania | 99.3 /100 | #85 | Exceptional 11.5% |
| Immigrants | Latvia | 99.2 /100 | #86 | Exceptional 11.6% |
| Immigrants | Nepal | 99.2 /100 | #87 | Exceptional 11.6% |
| Immigrants | Europe | 99.2 /100 | #88 | Exceptional 11.6% |
| Immigrants | Southern Europe | 99.1 /100 | #89 | Exceptional 11.6% |
| Zimbabweans | 99.0 /100 | #90 | Exceptional 11.6% |
| Spanish American Indians | 99.0 /100 | #91 | Exceptional 11.6% |
| Immigrants | Denmark | 98.9 /100 | #92 | Exceptional 11.6% |
| Arabs | 98.9 /100 | #93 | Exceptional 11.6% |
| Immigrants | Fiji | 98.9 /100 | #94 | Exceptional 11.6% |