Immigrants from Somalia vs Zimbabwean Divorced or Separated
COMPARE
Immigrants from Somalia
Zimbabwean
Divorced or Separated
Divorced or Separated Comparison
Immigrants from Somalia
Zimbabweans
12.6%
DIVORCED OR SEPARATED
0.6/ 100
METRIC RATING
257th/ 347
METRIC RANK
11.6%
DIVORCED OR SEPARATED
99.0/ 100
METRIC RATING
90th/ 347
METRIC RANK
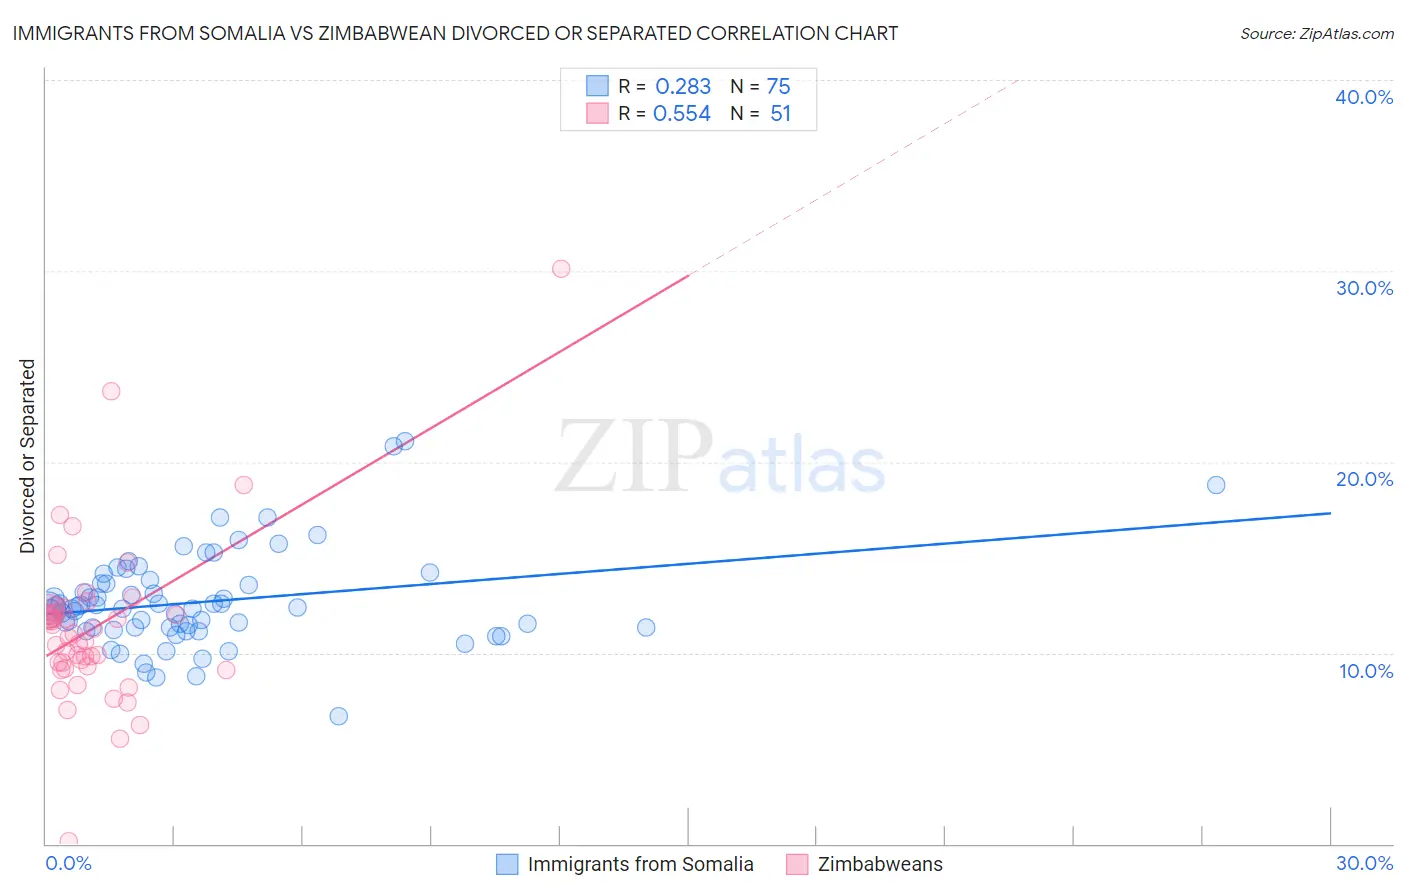
Immigrants from Somalia vs Zimbabwean Divorced or Separated Correlation Chart
The statistical analysis conducted on geographies consisting of 92,109,510 people shows a weak positive correlation between the proportion of Immigrants from Somalia and percentage of population currently divorced or separated in the United States with a correlation coefficient (R) of 0.283 and weighted average of 12.6%. Similarly, the statistical analysis conducted on geographies consisting of 69,193,915 people shows a substantial positive correlation between the proportion of Zimbabweans and percentage of population currently divorced or separated in the United States with a correlation coefficient (R) of 0.554 and weighted average of 11.6%, a difference of 8.8%.
Divorced or Separated Correlation Summary
| Measurement | Immigrants from Somalia | Zimbabwean |
| Minimum | 6.7% | 0.10% |
| Maximum | 21.1% | 30.1% |
| Range | 14.4% | 30.0% |
| Mean | 12.7% | 11.4% |
| Median | 12.3% | 11.0% |
| Interquartile 25% (IQ1) | 11.3% | 9.3% |
| Interquartile 75% (IQ3) | 13.6% | 12.2% |
| Interquartile Range (IQR) | 2.3% | 2.9% |
| Standard Deviation (Sample) | 2.5% | 4.4% |
| Standard Deviation (Population) | 2.5% | 4.4% |
Similar Demographics by Divorced or Separated
Demographics Similar to Immigrants from Somalia by Divorced or Separated
In terms of divorced or separated, the demographic groups most similar to Immigrants from Somalia are Indonesian (12.6%, a difference of 0.0%), Immigrants from Colombia (12.6%, a difference of 0.010%), Yuman (12.6%, a difference of 0.020%), Immigrants from Uruguay (12.6%, a difference of 0.020%), and Immigrants from Dominica (12.6%, a difference of 0.050%).
| Demographics | Rating | Rank | Divorced or Separated |
| Irish | 1.3 /100 | #250 | Tragic 12.5% |
| Aleuts | 1.3 /100 | #251 | Tragic 12.5% |
| Liberians | 0.9 /100 | #252 | Tragic 12.6% |
| Somalis | 0.9 /100 | #253 | Tragic 12.6% |
| Senegalese | 0.8 /100 | #254 | Tragic 12.6% |
| Welsh | 0.7 /100 | #255 | Tragic 12.6% |
| Immigrants | Colombia | 0.6 /100 | #256 | Tragic 12.6% |
| Immigrants | Somalia | 0.6 /100 | #257 | Tragic 12.6% |
| Indonesians | 0.6 /100 | #258 | Tragic 12.6% |
| Yuman | 0.6 /100 | #259 | Tragic 12.6% |
| Immigrants | Uruguay | 0.6 /100 | #260 | Tragic 12.6% |
| Immigrants | Dominica | 0.5 /100 | #261 | Tragic 12.6% |
| Basques | 0.5 /100 | #262 | Tragic 12.6% |
| Immigrants | Panama | 0.5 /100 | #263 | Tragic 12.6% |
| English | 0.5 /100 | #264 | Tragic 12.6% |
Demographics Similar to Zimbabweans by Divorced or Separated
In terms of divorced or separated, the demographic groups most similar to Zimbabweans are Spanish American Indian (11.6%, a difference of 0.040%), Immigrants from Southern Europe (11.6%, a difference of 0.10%), Immigrants from Denmark (11.6%, a difference of 0.10%), Arab (11.6%, a difference of 0.10%), and Immigrants from Fiji (11.6%, a difference of 0.11%).
| Demographics | Rating | Rank | Divorced or Separated |
| Immigrants | Bulgaria | 99.3 /100 | #83 | Exceptional 11.5% |
| Bulgarians | 99.3 /100 | #84 | Exceptional 11.5% |
| Immigrants | Albania | 99.3 /100 | #85 | Exceptional 11.5% |
| Immigrants | Latvia | 99.2 /100 | #86 | Exceptional 11.6% |
| Immigrants | Nepal | 99.2 /100 | #87 | Exceptional 11.6% |
| Immigrants | Europe | 99.2 /100 | #88 | Exceptional 11.6% |
| Immigrants | Southern Europe | 99.1 /100 | #89 | Exceptional 11.6% |
| Zimbabweans | 99.0 /100 | #90 | Exceptional 11.6% |
| Spanish American Indians | 99.0 /100 | #91 | Exceptional 11.6% |
| Immigrants | Denmark | 98.9 /100 | #92 | Exceptional 11.6% |
| Arabs | 98.9 /100 | #93 | Exceptional 11.6% |
| Immigrants | Fiji | 98.9 /100 | #94 | Exceptional 11.6% |
| Immigrants | Serbia | 98.8 /100 | #95 | Exceptional 11.6% |
| Immigrants | Ukraine | 98.7 /100 | #96 | Exceptional 11.6% |
| Latvians | 98.7 /100 | #97 | Exceptional 11.6% |