Maltese vs Zimbabwean Divorced or Separated
COMPARE
Maltese
Zimbabwean
Divorced or Separated
Divorced or Separated Comparison
Maltese
Zimbabweans
11.6%
DIVORCED OR SEPARATED
98.2/ 100
METRIC RATING
103rd/ 347
METRIC RANK
11.6%
DIVORCED OR SEPARATED
99.0/ 100
METRIC RATING
90th/ 347
METRIC RANK
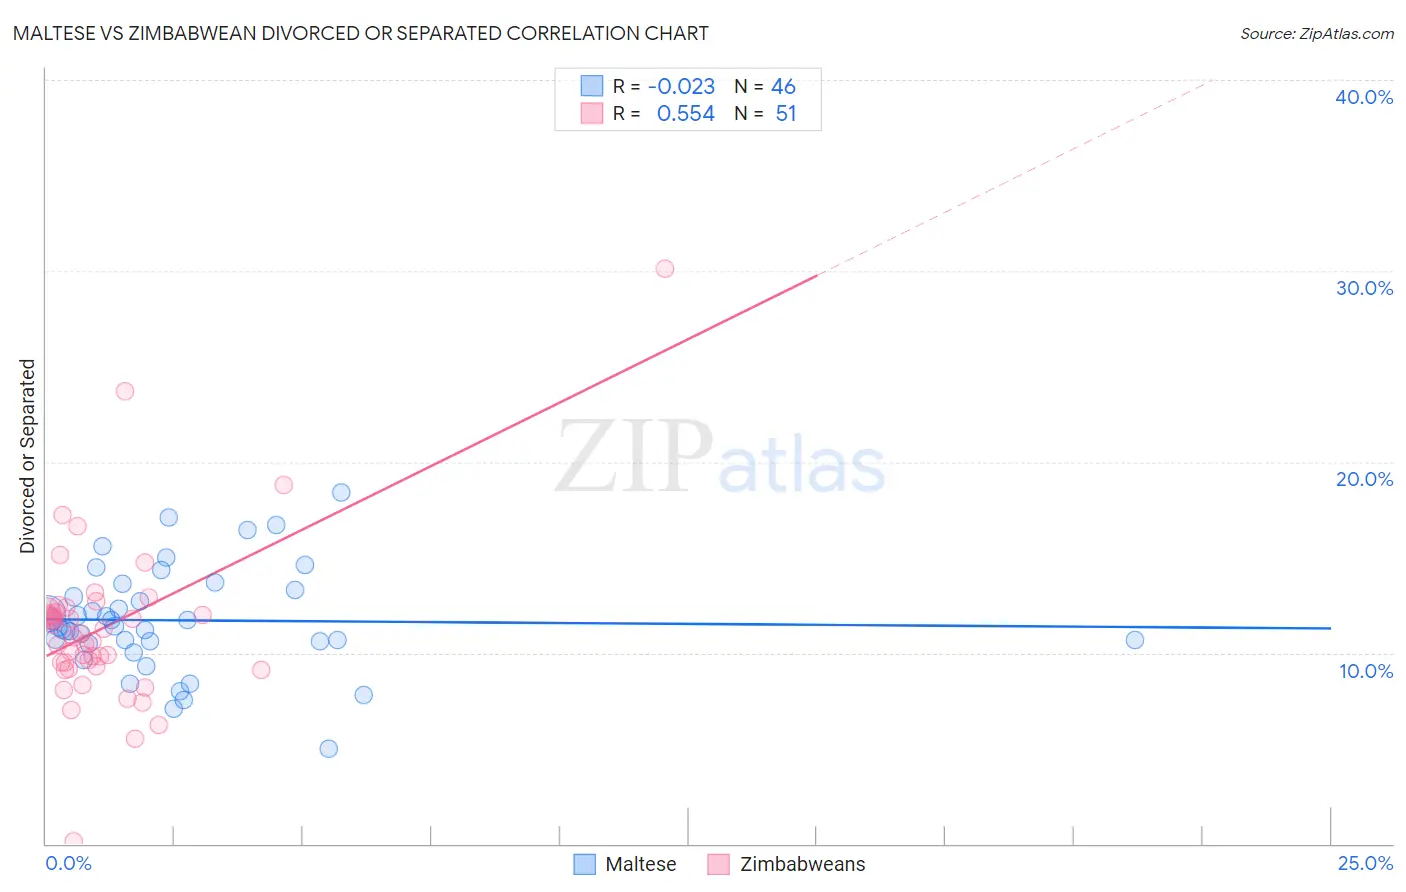
Maltese vs Zimbabwean Divorced or Separated Correlation Chart
The statistical analysis conducted on geographies consisting of 126,447,964 people shows no correlation between the proportion of Maltese and percentage of population currently divorced or separated in the United States with a correlation coefficient (R) of -0.023 and weighted average of 11.6%. Similarly, the statistical analysis conducted on geographies consisting of 69,193,915 people shows a substantial positive correlation between the proportion of Zimbabweans and percentage of population currently divorced or separated in the United States with a correlation coefficient (R) of 0.554 and weighted average of 11.6%, a difference of 0.56%.
Divorced or Separated Correlation Summary
| Measurement | Maltese | Zimbabwean |
| Minimum | 5.0% | 0.10% |
| Maximum | 18.4% | 30.1% |
| Range | 13.4% | 30.0% |
| Mean | 11.7% | 11.4% |
| Median | 11.4% | 11.0% |
| Interquartile 25% (IQ1) | 10.6% | 9.3% |
| Interquartile 75% (IQ3) | 13.3% | 12.2% |
| Interquartile Range (IQR) | 2.7% | 2.9% |
| Standard Deviation (Sample) | 2.8% | 4.4% |
| Standard Deviation (Population) | 2.7% | 4.4% |
Demographics Similar to Maltese and Zimbabweans by Divorced or Separated
In terms of divorced or separated, the demographic groups most similar to Maltese are Salvadoran (11.6%, a difference of 0.020%), Immigrants from Croatia (11.6%, a difference of 0.040%), Immigrants from El Salvador (11.7%, a difference of 0.14%), Immigrants from Guyana (11.6%, a difference of 0.18%), and Immigrants from Kazakhstan (11.7%, a difference of 0.18%). Similarly, the demographic groups most similar to Zimbabweans are Spanish American Indian (11.6%, a difference of 0.040%), Immigrants from Southern Europe (11.6%, a difference of 0.10%), Immigrants from Denmark (11.6%, a difference of 0.10%), Arab (11.6%, a difference of 0.10%), and Immigrants from Fiji (11.6%, a difference of 0.11%).
| Demographics | Rating | Rank | Divorced or Separated |
| Immigrants | Latvia | 99.2 /100 | #86 | Exceptional 11.6% |
| Immigrants | Nepal | 99.2 /100 | #87 | Exceptional 11.6% |
| Immigrants | Europe | 99.2 /100 | #88 | Exceptional 11.6% |
| Immigrants | Southern Europe | 99.1 /100 | #89 | Exceptional 11.6% |
| Zimbabweans | 99.0 /100 | #90 | Exceptional 11.6% |
| Spanish American Indians | 99.0 /100 | #91 | Exceptional 11.6% |
| Immigrants | Denmark | 98.9 /100 | #92 | Exceptional 11.6% |
| Arabs | 98.9 /100 | #93 | Exceptional 11.6% |
| Immigrants | Fiji | 98.9 /100 | #94 | Exceptional 11.6% |
| Immigrants | Serbia | 98.8 /100 | #95 | Exceptional 11.6% |
| Immigrants | Ukraine | 98.7 /100 | #96 | Exceptional 11.6% |
| Latvians | 98.7 /100 | #97 | Exceptional 11.6% |
| Immigrants | Jordan | 98.6 /100 | #98 | Exceptional 11.6% |
| Immigrants | Sweden | 98.6 /100 | #99 | Exceptional 11.6% |
| Immigrants | Northern Europe | 98.6 /100 | #100 | Exceptional 11.6% |
| Immigrants | Guyana | 98.5 /100 | #101 | Exceptional 11.6% |
| Immigrants | Croatia | 98.3 /100 | #102 | Exceptional 11.6% |
| Maltese | 98.2 /100 | #103 | Exceptional 11.6% |
| Salvadorans | 98.2 /100 | #104 | Exceptional 11.6% |
| Immigrants | El Salvador | 97.9 /100 | #105 | Exceptional 11.7% |
| Immigrants | Kazakhstan | 97.8 /100 | #106 | Exceptional 11.7% |