Japanese vs Zimbabwean Divorced or Separated
COMPARE
Japanese
Zimbabwean
Divorced or Separated
Divorced or Separated Comparison
Japanese
Zimbabweans
12.0%
DIVORCED OR SEPARATED
70.9/ 100
METRIC RATING
155th/ 347
METRIC RANK
11.6%
DIVORCED OR SEPARATED
99.0/ 100
METRIC RATING
90th/ 347
METRIC RANK
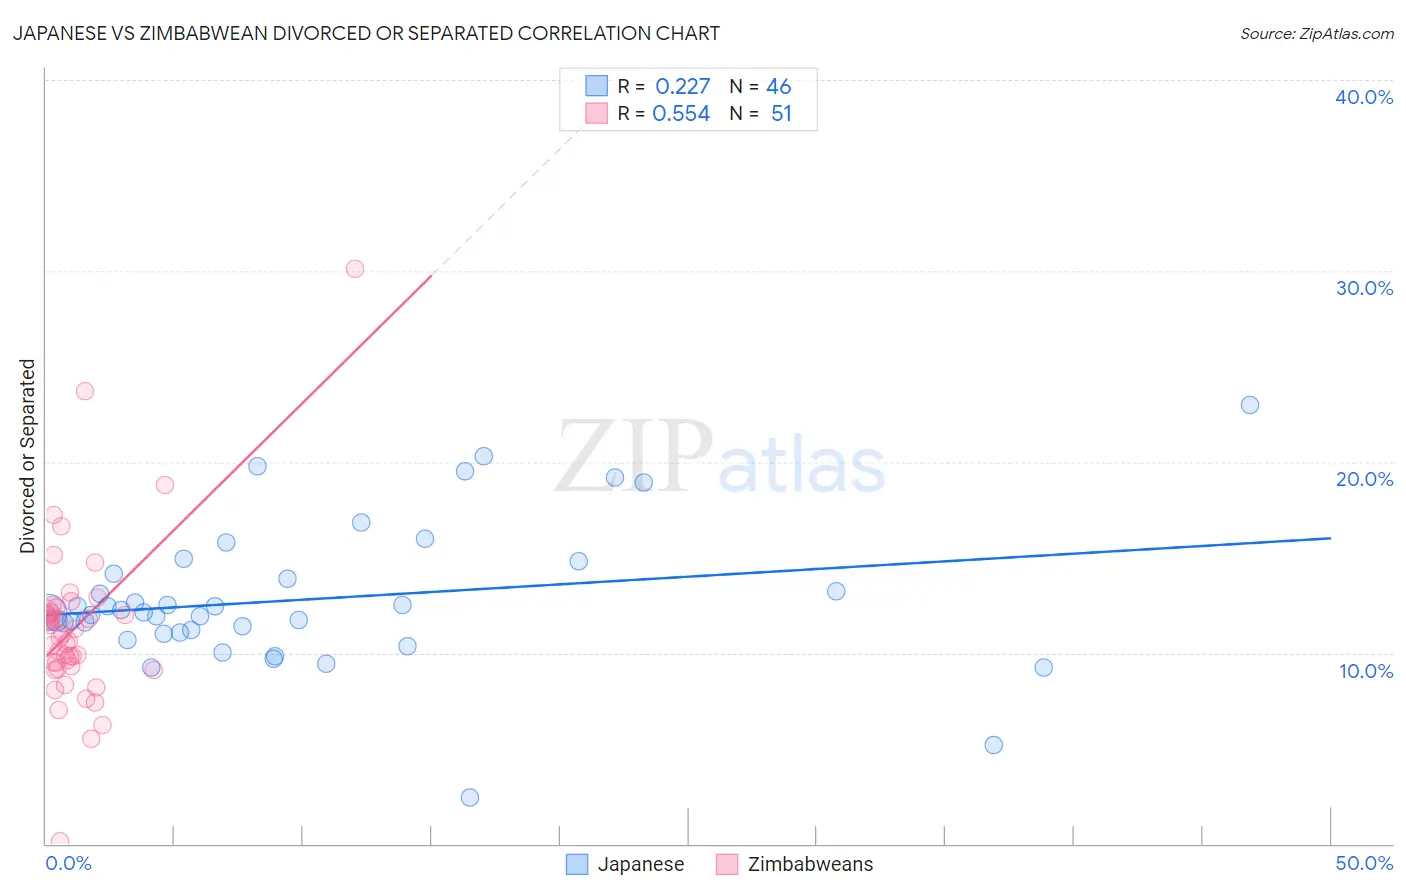
Japanese vs Zimbabwean Divorced or Separated Correlation Chart
The statistical analysis conducted on geographies consisting of 249,125,963 people shows a weak positive correlation between the proportion of Japanese and percentage of population currently divorced or separated in the United States with a correlation coefficient (R) of 0.227 and weighted average of 12.0%. Similarly, the statistical analysis conducted on geographies consisting of 69,193,915 people shows a substantial positive correlation between the proportion of Zimbabweans and percentage of population currently divorced or separated in the United States with a correlation coefficient (R) of 0.554 and weighted average of 11.6%, a difference of 3.4%.
Divorced or Separated Correlation Summary
| Measurement | Japanese | Zimbabwean |
| Minimum | 2.4% | 0.10% |
| Maximum | 23.0% | 30.1% |
| Range | 20.6% | 30.0% |
| Mean | 12.8% | 11.4% |
| Median | 12.1% | 11.0% |
| Interquartile 25% (IQ1) | 11.1% | 9.3% |
| Interquartile 75% (IQ3) | 14.1% | 12.2% |
| Interquartile Range (IQR) | 3.1% | 2.9% |
| Standard Deviation (Sample) | 3.8% | 4.4% |
| Standard Deviation (Population) | 3.7% | 4.4% |
Similar Demographics by Divorced or Separated
Demographics Similar to Japanese by Divorced or Separated
In terms of divorced or separated, the demographic groups most similar to Japanese are Chilean (12.0%, a difference of 0.020%), Hungarian (12.0%, a difference of 0.020%), Austrian (12.0%, a difference of 0.060%), Immigrants from Brazil (12.0%, a difference of 0.090%), and Immigrants from Hungary (11.9%, a difference of 0.12%).
| Demographics | Rating | Rank | Divorced or Separated |
| Italians | 77.8 /100 | #148 | Good 11.9% |
| Immigrants | Oceania | 77.7 /100 | #149 | Good 11.9% |
| Immigrants | Portugal | 77.3 /100 | #150 | Good 11.9% |
| Czechs | 76.4 /100 | #151 | Good 11.9% |
| Immigrants | Hungary | 73.7 /100 | #152 | Good 11.9% |
| Austrians | 72.2 /100 | #153 | Good 12.0% |
| Chileans | 71.3 /100 | #154 | Good 12.0% |
| Japanese | 70.9 /100 | #155 | Good 12.0% |
| Hungarians | 70.3 /100 | #156 | Good 12.0% |
| Immigrants | Brazil | 68.8 /100 | #157 | Good 12.0% |
| Icelanders | 66.0 /100 | #158 | Good 12.0% |
| Immigrants | Barbados | 66.0 /100 | #159 | Good 12.0% |
| Immigrants | Scotland | 65.8 /100 | #160 | Good 12.0% |
| Marshallese | 64.6 /100 | #161 | Good 12.0% |
| Samoans | 64.3 /100 | #162 | Good 12.0% |
Demographics Similar to Zimbabweans by Divorced or Separated
In terms of divorced or separated, the demographic groups most similar to Zimbabweans are Spanish American Indian (11.6%, a difference of 0.040%), Immigrants from Southern Europe (11.6%, a difference of 0.10%), Immigrants from Denmark (11.6%, a difference of 0.10%), Arab (11.6%, a difference of 0.10%), and Immigrants from Fiji (11.6%, a difference of 0.11%).
| Demographics | Rating | Rank | Divorced or Separated |
| Immigrants | Bulgaria | 99.3 /100 | #83 | Exceptional 11.5% |
| Bulgarians | 99.3 /100 | #84 | Exceptional 11.5% |
| Immigrants | Albania | 99.3 /100 | #85 | Exceptional 11.5% |
| Immigrants | Latvia | 99.2 /100 | #86 | Exceptional 11.6% |
| Immigrants | Nepal | 99.2 /100 | #87 | Exceptional 11.6% |
| Immigrants | Europe | 99.2 /100 | #88 | Exceptional 11.6% |
| Immigrants | Southern Europe | 99.1 /100 | #89 | Exceptional 11.6% |
| Zimbabweans | 99.0 /100 | #90 | Exceptional 11.6% |
| Spanish American Indians | 99.0 /100 | #91 | Exceptional 11.6% |
| Immigrants | Denmark | 98.9 /100 | #92 | Exceptional 11.6% |
| Arabs | 98.9 /100 | #93 | Exceptional 11.6% |
| Immigrants | Fiji | 98.9 /100 | #94 | Exceptional 11.6% |
| Immigrants | Serbia | 98.8 /100 | #95 | Exceptional 11.6% |
| Immigrants | Ukraine | 98.7 /100 | #96 | Exceptional 11.6% |
| Latvians | 98.7 /100 | #97 | Exceptional 11.6% |