Marshallese vs Zimbabwean Single Mother Poverty
COMPARE
Marshallese
Zimbabwean
Single Mother Poverty
Single Mother Poverty Comparison
Marshallese
Zimbabweans
32.1%
SINGLE MOTHER POVERTY
0.0/ 100
METRIC RATING
279th/ 347
METRIC RANK
27.9%
SINGLE MOTHER POVERTY
97.1/ 100
METRIC RATING
100th/ 347
METRIC RANK
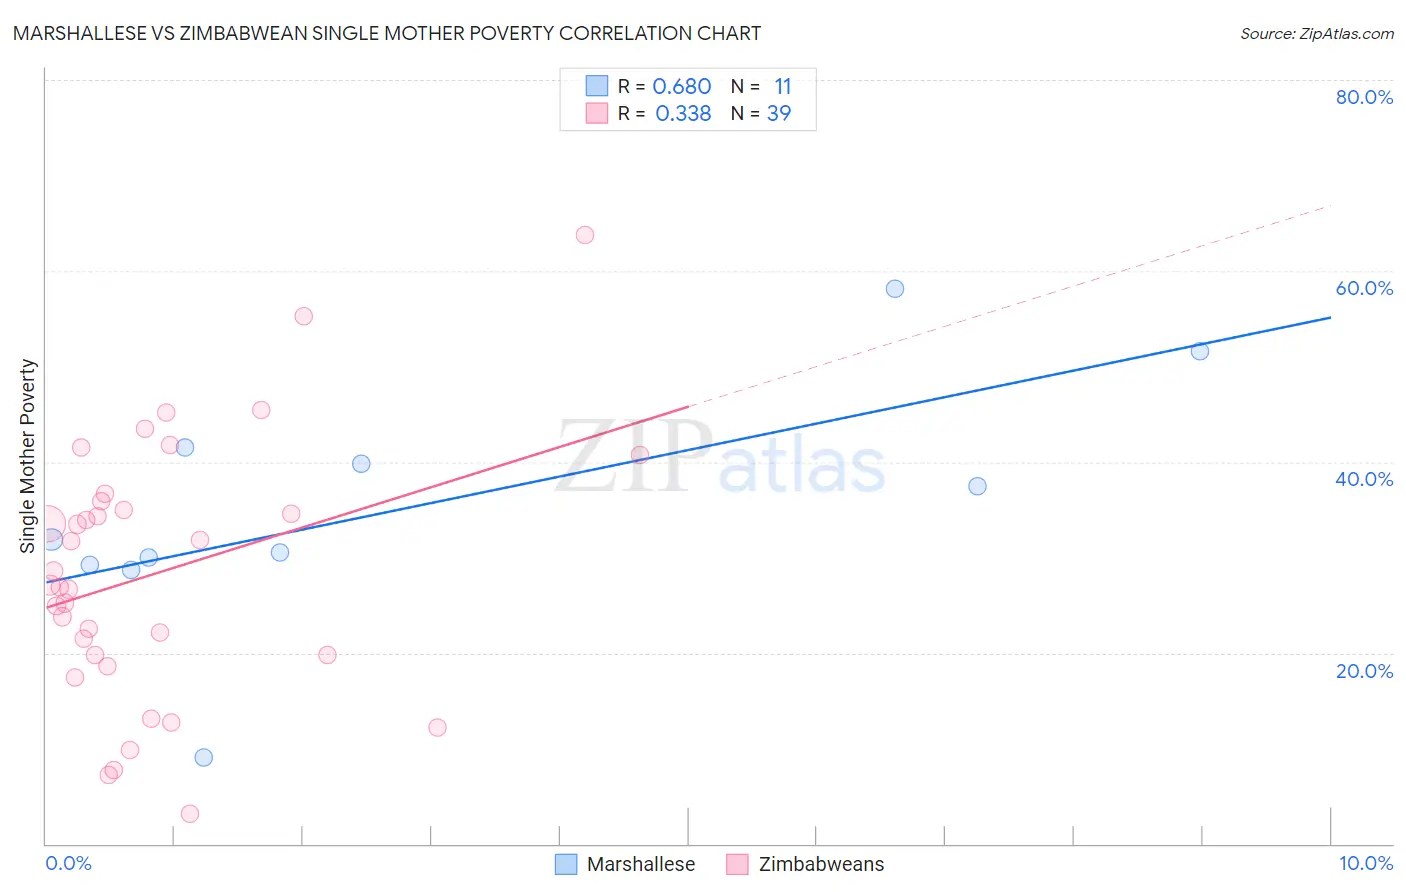
Marshallese vs Zimbabwean Single Mother Poverty Correlation Chart
The statistical analysis conducted on geographies consisting of 14,718,372 people shows a significant positive correlation between the proportion of Marshallese and poverty level among single mothers in the United States with a correlation coefficient (R) of 0.680 and weighted average of 32.1%. Similarly, the statistical analysis conducted on geographies consisting of 68,932,281 people shows a mild positive correlation between the proportion of Zimbabweans and poverty level among single mothers in the United States with a correlation coefficient (R) of 0.338 and weighted average of 27.9%, a difference of 14.9%.
Single Mother Poverty Correlation Summary
| Measurement | Marshallese | Zimbabwean |
| Minimum | 9.1% | 3.1% |
| Maximum | 58.1% | 63.7% |
| Range | 49.0% | 60.6% |
| Mean | 35.3% | 28.4% |
| Median | 31.9% | 27.1% |
| Interquartile 25% (IQ1) | 29.2% | 19.7% |
| Interquartile 75% (IQ3) | 41.5% | 35.9% |
| Interquartile Range (IQR) | 12.3% | 16.1% |
| Standard Deviation (Sample) | 13.0% | 13.3% |
| Standard Deviation (Population) | 12.4% | 13.2% |
Similar Demographics by Single Mother Poverty
Demographics Similar to Marshallese by Single Mother Poverty
In terms of single mother poverty, the demographic groups most similar to Marshallese are Nonimmigrants (32.2%, a difference of 0.22%), Cree (32.2%, a difference of 0.24%), Immigrants from the Azores (32.2%, a difference of 0.36%), Immigrants from Zaire (32.0%, a difference of 0.40%), and Spanish American (32.3%, a difference of 0.61%).
| Demographics | Rating | Rank | Single Mother Poverty |
| Immigrants | Micronesia | 0.1 /100 | #272 | Tragic 31.6% |
| Fijians | 0.1 /100 | #273 | Tragic 31.6% |
| Bangladeshis | 0.1 /100 | #274 | Tragic 31.7% |
| Central Americans | 0.1 /100 | #275 | Tragic 31.8% |
| Delaware | 0.0 /100 | #276 | Tragic 31.8% |
| Mexican American Indians | 0.0 /100 | #277 | Tragic 31.9% |
| Immigrants | Zaire | 0.0 /100 | #278 | Tragic 32.0% |
| Marshallese | 0.0 /100 | #279 | Tragic 32.1% |
| Immigrants | Nonimmigrants | 0.0 /100 | #280 | Tragic 32.2% |
| Cree | 0.0 /100 | #281 | Tragic 32.2% |
| Immigrants | Azores | 0.0 /100 | #282 | Tragic 32.2% |
| Spanish Americans | 0.0 /100 | #283 | Tragic 32.3% |
| Indonesians | 0.0 /100 | #284 | Tragic 32.4% |
| Immigrants | Latin America | 0.0 /100 | #285 | Tragic 32.4% |
| Yup'ik | 0.0 /100 | #286 | Tragic 32.5% |
Demographics Similar to Zimbabweans by Single Mother Poverty
In terms of single mother poverty, the demographic groups most similar to Zimbabweans are Immigrants from Netherlands (27.9%, a difference of 0.050%), Immigrants from Nepal (27.9%, a difference of 0.060%), Immigrants from Brazil (27.9%, a difference of 0.070%), Pakistani (28.0%, a difference of 0.070%), and Immigrants from Iraq (27.9%, a difference of 0.11%).
| Demographics | Rating | Rank | Single Mother Poverty |
| Romanians | 97.8 /100 | #93 | Exceptional 27.8% |
| Albanians | 97.6 /100 | #94 | Exceptional 27.9% |
| Chileans | 97.5 /100 | #95 | Exceptional 27.9% |
| Immigrants | Iraq | 97.3 /100 | #96 | Exceptional 27.9% |
| Immigrants | Brazil | 97.2 /100 | #97 | Exceptional 27.9% |
| Immigrants | Nepal | 97.2 /100 | #98 | Exceptional 27.9% |
| Immigrants | Netherlands | 97.2 /100 | #99 | Exceptional 27.9% |
| Zimbabweans | 97.1 /100 | #100 | Exceptional 27.9% |
| Pakistanis | 96.9 /100 | #101 | Exceptional 28.0% |
| Immigrants | Croatia | 96.7 /100 | #102 | Exceptional 28.0% |
| Immigrants | Northern Africa | 96.6 /100 | #103 | Exceptional 28.0% |
| Italians | 96.6 /100 | #104 | Exceptional 28.0% |
| Israelis | 96.5 /100 | #105 | Exceptional 28.0% |
| Ukrainians | 96.4 /100 | #106 | Exceptional 28.0% |
| Immigrants | Venezuela | 95.8 /100 | #107 | Exceptional 28.1% |