Marshallese vs French Canadian Divorced or Separated
COMPARE
Marshallese
French Canadian
Divorced or Separated
Divorced or Separated Comparison
Marshallese
French Canadians
12.0%
DIVORCED OR SEPARATED
64.6/ 100
METRIC RATING
161st/ 347
METRIC RANK
12.8%
DIVORCED OR SEPARATED
0.1/ 100
METRIC RATING
288th/ 347
METRIC RANK
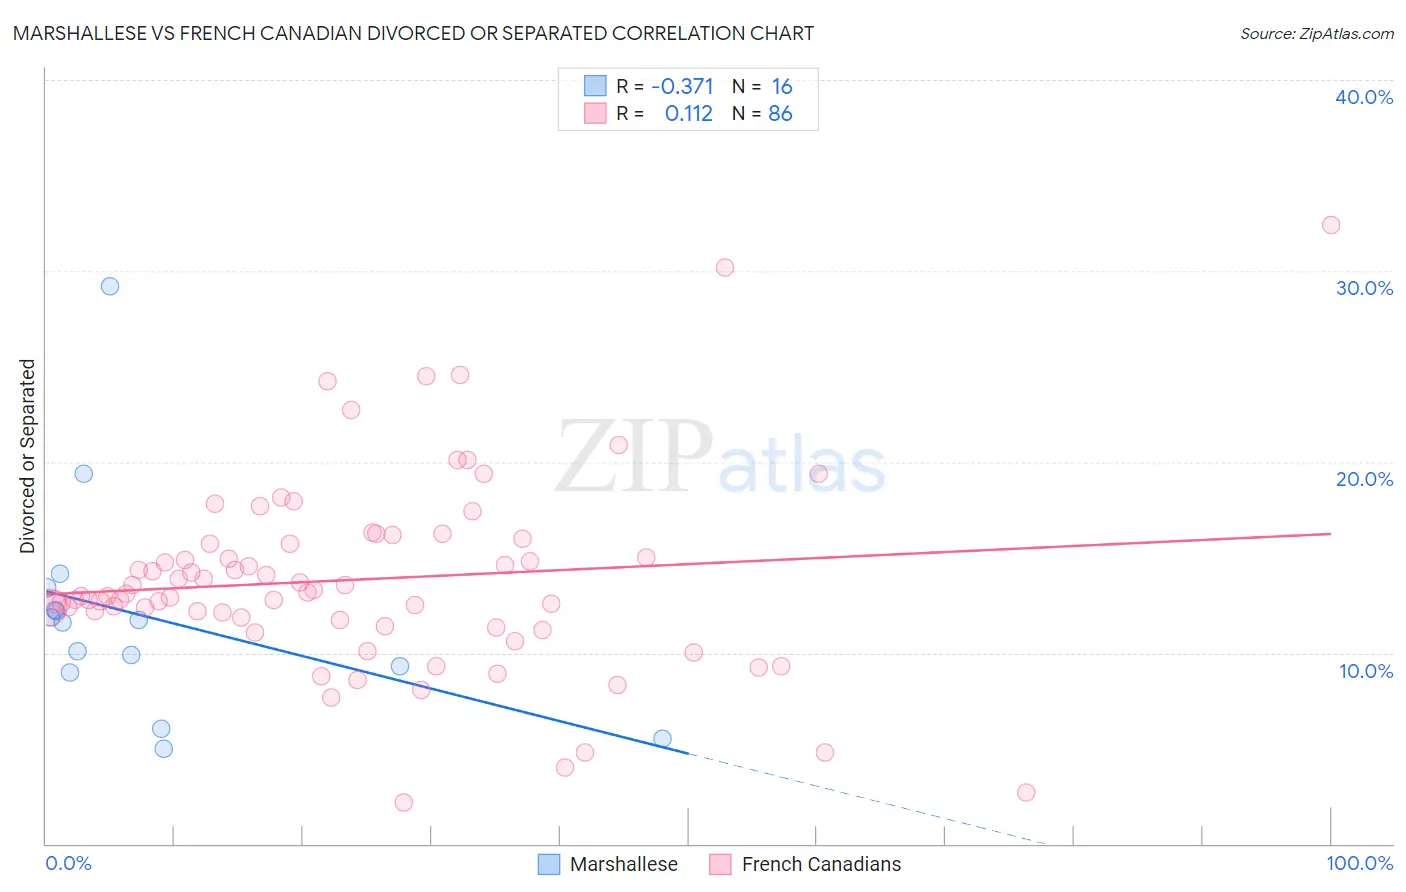
Marshallese vs French Canadian Divorced or Separated Correlation Chart
The statistical analysis conducted on geographies consisting of 14,761,315 people shows a mild negative correlation between the proportion of Marshallese and percentage of population currently divorced or separated in the United States with a correlation coefficient (R) of -0.371 and weighted average of 12.0%. Similarly, the statistical analysis conducted on geographies consisting of 502,403,685 people shows a poor positive correlation between the proportion of French Canadians and percentage of population currently divorced or separated in the United States with a correlation coefficient (R) of 0.112 and weighted average of 12.8%, a difference of 7.1%.
Divorced or Separated Correlation Summary
| Measurement | Marshallese | French Canadian |
| Minimum | 5.0% | 2.2% |
| Maximum | 29.2% | 32.4% |
| Range | 24.2% | 30.2% |
| Mean | 11.9% | 13.8% |
| Median | 11.7% | 13.0% |
| Interquartile 25% (IQ1) | 9.1% | 11.7% |
| Interquartile 75% (IQ3) | 12.8% | 15.7% |
| Interquartile Range (IQR) | 3.7% | 4.0% |
| Standard Deviation (Sample) | 5.8% | 5.1% |
| Standard Deviation (Population) | 5.6% | 5.1% |
Similar Demographics by Divorced or Separated
Demographics Similar to Marshallese by Divorced or Separated
In terms of divorced or separated, the demographic groups most similar to Marshallese are Samoan (12.0%, a difference of 0.010%), Navajo (12.0%, a difference of 0.030%), Immigrants from Scotland (12.0%, a difference of 0.040%), Swiss (12.0%, a difference of 0.040%), and Immigrants from Barbados (12.0%, a difference of 0.050%).
| Demographics | Rating | Rank | Divorced or Separated |
| Chileans | 71.3 /100 | #154 | Good 12.0% |
| Japanese | 70.9 /100 | #155 | Good 12.0% |
| Hungarians | 70.3 /100 | #156 | Good 12.0% |
| Immigrants | Brazil | 68.8 /100 | #157 | Good 12.0% |
| Icelanders | 66.0 /100 | #158 | Good 12.0% |
| Immigrants | Barbados | 66.0 /100 | #159 | Good 12.0% |
| Immigrants | Scotland | 65.8 /100 | #160 | Good 12.0% |
| Marshallese | 64.6 /100 | #161 | Good 12.0% |
| Samoans | 64.3 /100 | #162 | Good 12.0% |
| Navajo | 63.9 /100 | #163 | Good 12.0% |
| Swiss | 63.6 /100 | #164 | Good 12.0% |
| German Russians | 61.8 /100 | #165 | Good 12.0% |
| Tohono O'odham | 60.4 /100 | #166 | Good 12.0% |
| Ethiopians | 58.5 /100 | #167 | Average 12.0% |
| Serbians | 57.1 /100 | #168 | Average 12.0% |
Demographics Similar to French Canadians by Divorced or Separated
In terms of divorced or separated, the demographic groups most similar to French Canadians are Iroquois (12.9%, a difference of 0.15%), Honduran (12.8%, a difference of 0.26%), Pima (12.9%, a difference of 0.29%), Immigrants from Honduras (12.9%, a difference of 0.41%), and Spanish (12.8%, a difference of 0.45%).
| Demographics | Rating | Rank | Divorced or Separated |
| Pueblo | 0.2 /100 | #281 | Tragic 12.7% |
| Sub-Saharan Africans | 0.1 /100 | #282 | Tragic 12.7% |
| Delaware | 0.1 /100 | #283 | Tragic 12.7% |
| Immigrants | Nonimmigrants | 0.1 /100 | #284 | Tragic 12.8% |
| French | 0.1 /100 | #285 | Tragic 12.8% |
| Spanish | 0.1 /100 | #286 | Tragic 12.8% |
| Hondurans | 0.1 /100 | #287 | Tragic 12.8% |
| French Canadians | 0.1 /100 | #288 | Tragic 12.8% |
| Iroquois | 0.0 /100 | #289 | Tragic 12.9% |
| Pima | 0.0 /100 | #290 | Tragic 12.9% |
| Immigrants | Honduras | 0.0 /100 | #291 | Tragic 12.9% |
| Scotch-Irish | 0.0 /100 | #292 | Tragic 12.9% |
| Jamaicans | 0.0 /100 | #293 | Tragic 12.9% |
| Apache | 0.0 /100 | #294 | Tragic 12.9% |
| Celtics | 0.0 /100 | #295 | Tragic 13.0% |