Marshallese vs Immigrants from Iraq Divorced or Separated
COMPARE
Marshallese
Immigrants from Iraq
Divorced or Separated
Divorced or Separated Comparison
Marshallese
Immigrants from Iraq
12.0%
DIVORCED OR SEPARATED
64.6/ 100
METRIC RATING
161st/ 347
METRIC RANK
11.7%
DIVORCED OR SEPARATED
95.4/ 100
METRIC RATING
116th/ 347
METRIC RANK
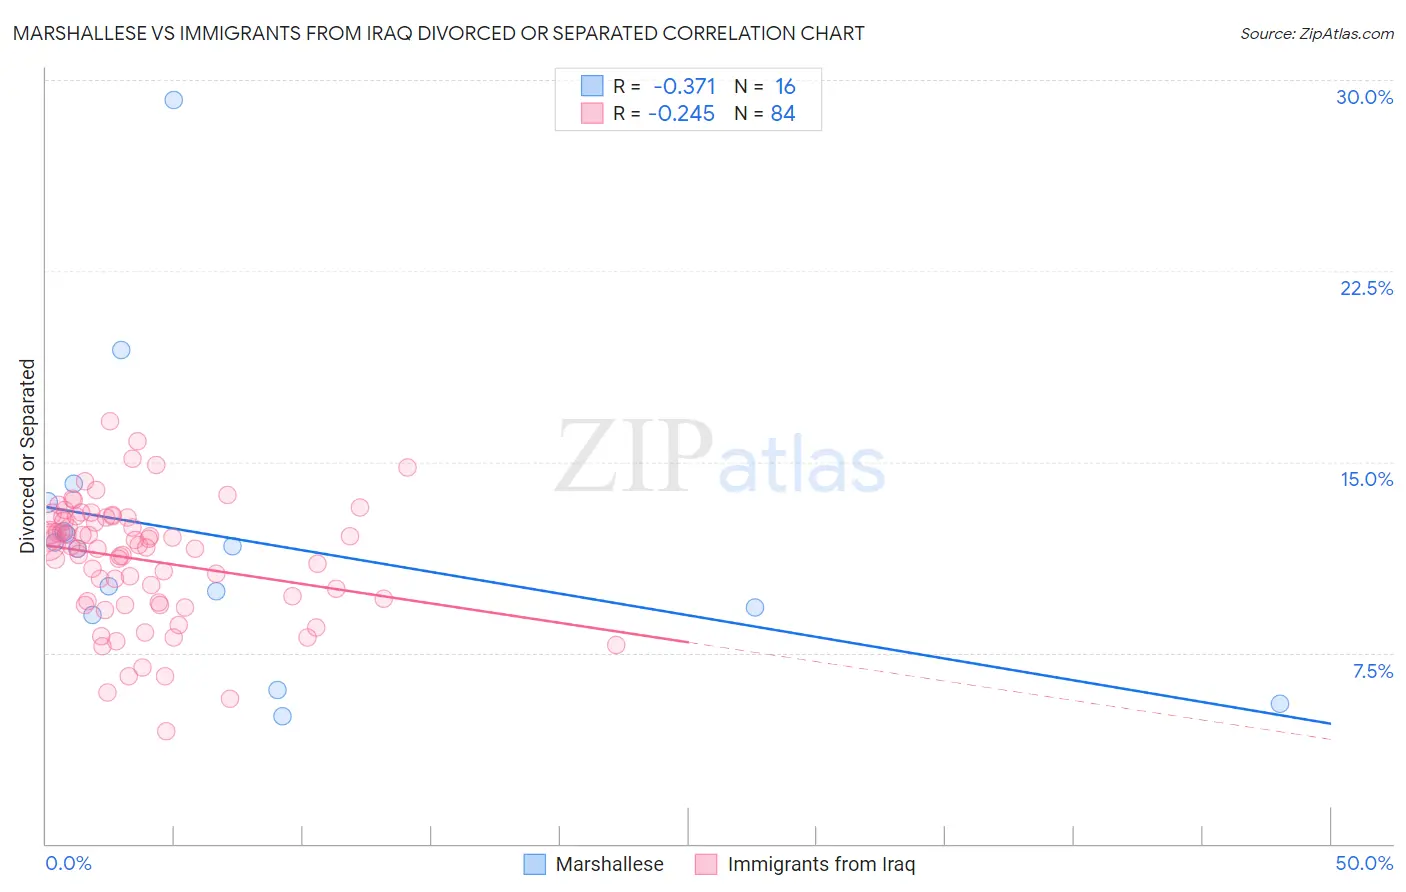
Marshallese vs Immigrants from Iraq Divorced or Separated Correlation Chart
The statistical analysis conducted on geographies consisting of 14,761,315 people shows a mild negative correlation between the proportion of Marshallese and percentage of population currently divorced or separated in the United States with a correlation coefficient (R) of -0.371 and weighted average of 12.0%. Similarly, the statistical analysis conducted on geographies consisting of 194,763,977 people shows a weak negative correlation between the proportion of Immigrants from Iraq and percentage of population currently divorced or separated in the United States with a correlation coefficient (R) of -0.245 and weighted average of 11.7%, a difference of 2.2%.
Divorced or Separated Correlation Summary
| Measurement | Marshallese | Immigrants from Iraq |
| Minimum | 5.0% | 4.4% |
| Maximum | 29.2% | 16.6% |
| Range | 24.2% | 12.2% |
| Mean | 11.9% | 11.1% |
| Median | 11.7% | 11.7% |
| Interquartile 25% (IQ1) | 9.1% | 9.5% |
| Interquartile 75% (IQ3) | 12.8% | 12.8% |
| Interquartile Range (IQR) | 3.7% | 3.3% |
| Standard Deviation (Sample) | 5.8% | 2.4% |
| Standard Deviation (Population) | 5.6% | 2.4% |
Similar Demographics by Divorced or Separated
Demographics Similar to Marshallese by Divorced or Separated
In terms of divorced or separated, the demographic groups most similar to Marshallese are Samoan (12.0%, a difference of 0.010%), Navajo (12.0%, a difference of 0.030%), Immigrants from Scotland (12.0%, a difference of 0.040%), Swiss (12.0%, a difference of 0.040%), and Immigrants from Barbados (12.0%, a difference of 0.050%).
| Demographics | Rating | Rank | Divorced or Separated |
| Chileans | 71.3 /100 | #154 | Good 12.0% |
| Japanese | 70.9 /100 | #155 | Good 12.0% |
| Hungarians | 70.3 /100 | #156 | Good 12.0% |
| Immigrants | Brazil | 68.8 /100 | #157 | Good 12.0% |
| Icelanders | 66.0 /100 | #158 | Good 12.0% |
| Immigrants | Barbados | 66.0 /100 | #159 | Good 12.0% |
| Immigrants | Scotland | 65.8 /100 | #160 | Good 12.0% |
| Marshallese | 64.6 /100 | #161 | Good 12.0% |
| Samoans | 64.3 /100 | #162 | Good 12.0% |
| Navajo | 63.9 /100 | #163 | Good 12.0% |
| Swiss | 63.6 /100 | #164 | Good 12.0% |
| German Russians | 61.8 /100 | #165 | Good 12.0% |
| Tohono O'odham | 60.4 /100 | #166 | Good 12.0% |
| Ethiopians | 58.5 /100 | #167 | Average 12.0% |
| Serbians | 57.1 /100 | #168 | Average 12.0% |
Demographics Similar to Immigrants from Iraq by Divorced or Separated
In terms of divorced or separated, the demographic groups most similar to Immigrants from Iraq are Immigrants from Uganda (11.7%, a difference of 0.020%), Ecuadorian (11.7%, a difference of 0.020%), Lithuanian (11.7%, a difference of 0.060%), Syrian (11.7%, a difference of 0.060%), and Immigrants from Norway (11.7%, a difference of 0.12%).
| Demographics | Rating | Rank | Divorced or Separated |
| Immigrants | South Africa | 96.9 /100 | #109 | Exceptional 11.7% |
| Immigrants | Czechoslovakia | 96.9 /100 | #110 | Exceptional 11.7% |
| Immigrants | Spain | 96.8 /100 | #111 | Exceptional 11.7% |
| Immigrants | France | 96.6 /100 | #112 | Exceptional 11.7% |
| Estonians | 96.6 /100 | #113 | Exceptional 11.7% |
| Immigrants | Norway | 95.9 /100 | #114 | Exceptional 11.7% |
| Lithuanians | 95.7 /100 | #115 | Exceptional 11.7% |
| Immigrants | Iraq | 95.4 /100 | #116 | Exceptional 11.7% |
| Immigrants | Uganda | 95.3 /100 | #117 | Exceptional 11.7% |
| Ecuadorians | 95.3 /100 | #118 | Exceptional 11.7% |
| Syrians | 95.1 /100 | #119 | Exceptional 11.7% |
| Iraqis | 94.6 /100 | #120 | Exceptional 11.8% |
| Romanians | 94.5 /100 | #121 | Exceptional 11.8% |
| Menominee | 93.8 /100 | #122 | Exceptional 11.8% |
| Immigrants | Immigrants | 93.7 /100 | #123 | Exceptional 11.8% |