Marshallese vs Hmong Divorced or Separated
COMPARE
Marshallese
Hmong
Divorced or Separated
Divorced or Separated Comparison
Marshallese
Hmong
12.0%
DIVORCED OR SEPARATED
64.6/ 100
METRIC RATING
161st/ 347
METRIC RANK
12.3%
DIVORCED OR SEPARATED
8.8/ 100
METRIC RATING
227th/ 347
METRIC RANK
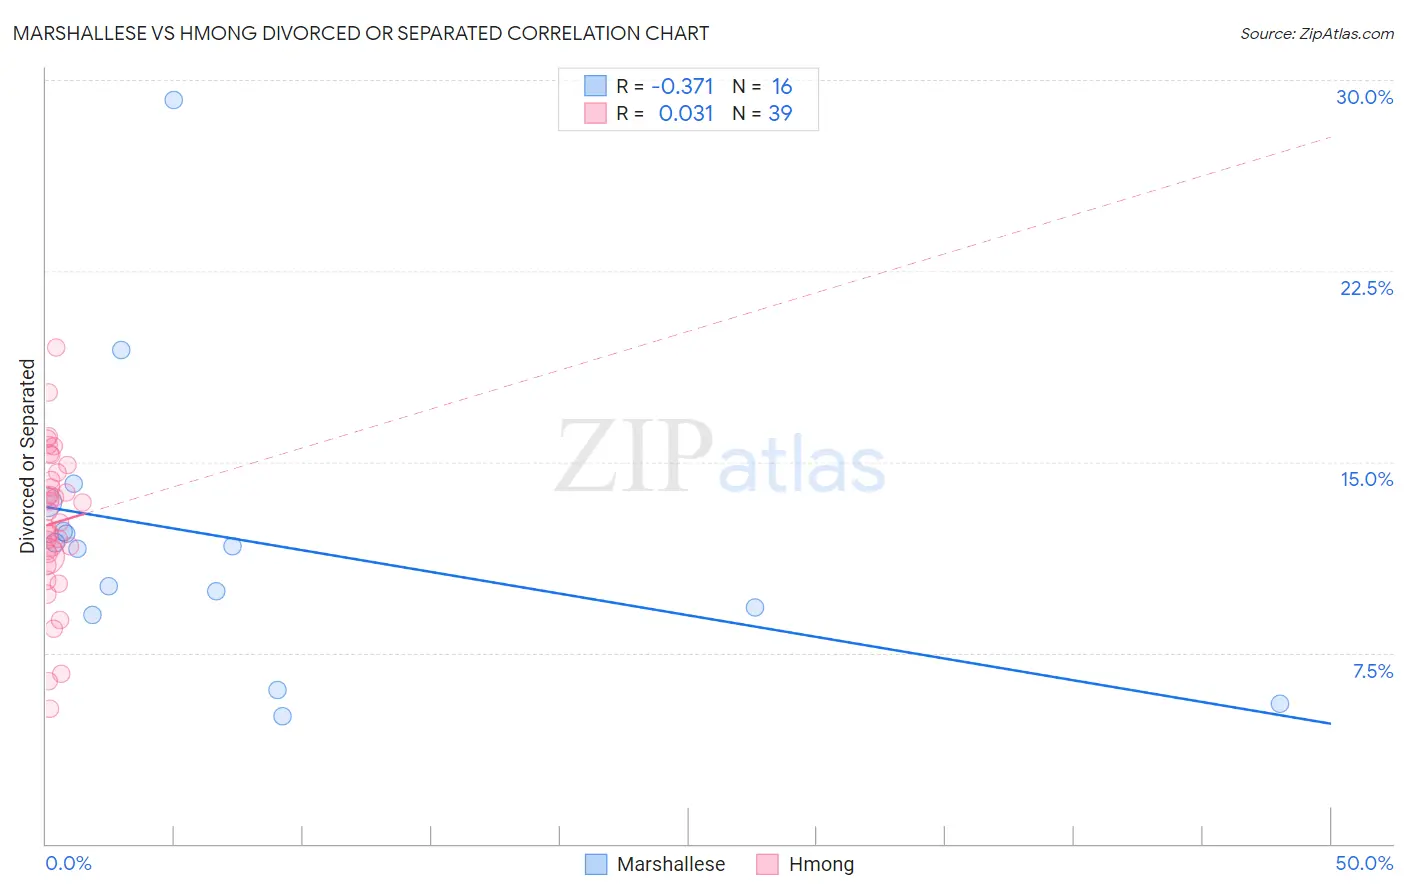
Marshallese vs Hmong Divorced or Separated Correlation Chart
The statistical analysis conducted on geographies consisting of 14,761,315 people shows a mild negative correlation between the proportion of Marshallese and percentage of population currently divorced or separated in the United States with a correlation coefficient (R) of -0.371 and weighted average of 12.0%. Similarly, the statistical analysis conducted on geographies consisting of 24,678,157 people shows no correlation between the proportion of Hmong and percentage of population currently divorced or separated in the United States with a correlation coefficient (R) of 0.031 and weighted average of 12.3%, a difference of 2.6%.
Divorced or Separated Correlation Summary
| Measurement | Marshallese | Hmong |
| Minimum | 5.0% | 5.3% |
| Maximum | 29.2% | 19.5% |
| Range | 24.2% | 14.2% |
| Mean | 11.9% | 12.6% |
| Median | 11.7% | 12.6% |
| Interquartile 25% (IQ1) | 9.1% | 11.3% |
| Interquartile 75% (IQ3) | 12.8% | 14.6% |
| Interquartile Range (IQR) | 3.7% | 3.3% |
| Standard Deviation (Sample) | 5.8% | 3.0% |
| Standard Deviation (Population) | 5.6% | 2.9% |
Similar Demographics by Divorced or Separated
Demographics Similar to Marshallese by Divorced or Separated
In terms of divorced or separated, the demographic groups most similar to Marshallese are Samoan (12.0%, a difference of 0.010%), Navajo (12.0%, a difference of 0.030%), Immigrants from Scotland (12.0%, a difference of 0.040%), Swiss (12.0%, a difference of 0.040%), and Immigrants from Barbados (12.0%, a difference of 0.050%).
| Demographics | Rating | Rank | Divorced or Separated |
| Chileans | 71.3 /100 | #154 | Good 12.0% |
| Japanese | 70.9 /100 | #155 | Good 12.0% |
| Hungarians | 70.3 /100 | #156 | Good 12.0% |
| Immigrants | Brazil | 68.8 /100 | #157 | Good 12.0% |
| Icelanders | 66.0 /100 | #158 | Good 12.0% |
| Immigrants | Barbados | 66.0 /100 | #159 | Good 12.0% |
| Immigrants | Scotland | 65.8 /100 | #160 | Good 12.0% |
| Marshallese | 64.6 /100 | #161 | Good 12.0% |
| Samoans | 64.3 /100 | #162 | Good 12.0% |
| Navajo | 63.9 /100 | #163 | Good 12.0% |
| Swiss | 63.6 /100 | #164 | Good 12.0% |
| German Russians | 61.8 /100 | #165 | Good 12.0% |
| Tohono O'odham | 60.4 /100 | #166 | Good 12.0% |
| Ethiopians | 58.5 /100 | #167 | Average 12.0% |
| Serbians | 57.1 /100 | #168 | Average 12.0% |
Demographics Similar to Hmong by Divorced or Separated
In terms of divorced or separated, the demographic groups most similar to Hmong are Immigrants from Western Africa (12.3%, a difference of 0.050%), Immigrants from Cameroon (12.3%, a difference of 0.050%), Immigrants from Sudan (12.3%, a difference of 0.070%), Immigrants from the Azores (12.3%, a difference of 0.090%), and Belgian (12.3%, a difference of 0.090%).
| Demographics | Rating | Rank | Divorced or Separated |
| British | 11.6 /100 | #220 | Poor 12.3% |
| Guamanians/Chamorros | 11.3 /100 | #221 | Poor 12.3% |
| Bangladeshis | 10.5 /100 | #222 | Poor 12.3% |
| Scandinavians | 10.4 /100 | #223 | Poor 12.3% |
| Immigrants | Azores | 9.7 /100 | #224 | Tragic 12.3% |
| Belgians | 9.7 /100 | #225 | Tragic 12.3% |
| Immigrants | Western Africa | 9.3 /100 | #226 | Tragic 12.3% |
| Hmong | 8.8 /100 | #227 | Tragic 12.3% |
| Immigrants | Cameroon | 8.3 /100 | #228 | Tragic 12.3% |
| Immigrants | Sudan | 8.2 /100 | #229 | Tragic 12.3% |
| Yakama | 7.8 /100 | #230 | Tragic 12.3% |
| Yugoslavians | 6.6 /100 | #231 | Tragic 12.3% |
| Canadians | 5.3 /100 | #232 | Tragic 12.4% |
| Malaysians | 4.8 /100 | #233 | Tragic 12.4% |
| West Indians | 4.4 /100 | #234 | Tragic 12.4% |