Marshallese vs Immigrants from Eritrea Divorced or Separated
COMPARE
Marshallese
Immigrants from Eritrea
Divorced or Separated
Divorced or Separated Comparison
Marshallese
Immigrants from Eritrea
12.0%
DIVORCED OR SEPARATED
64.6/ 100
METRIC RATING
161st/ 347
METRIC RANK
12.1%
DIVORCED OR SEPARATED
31.9/ 100
METRIC RATING
194th/ 347
METRIC RANK
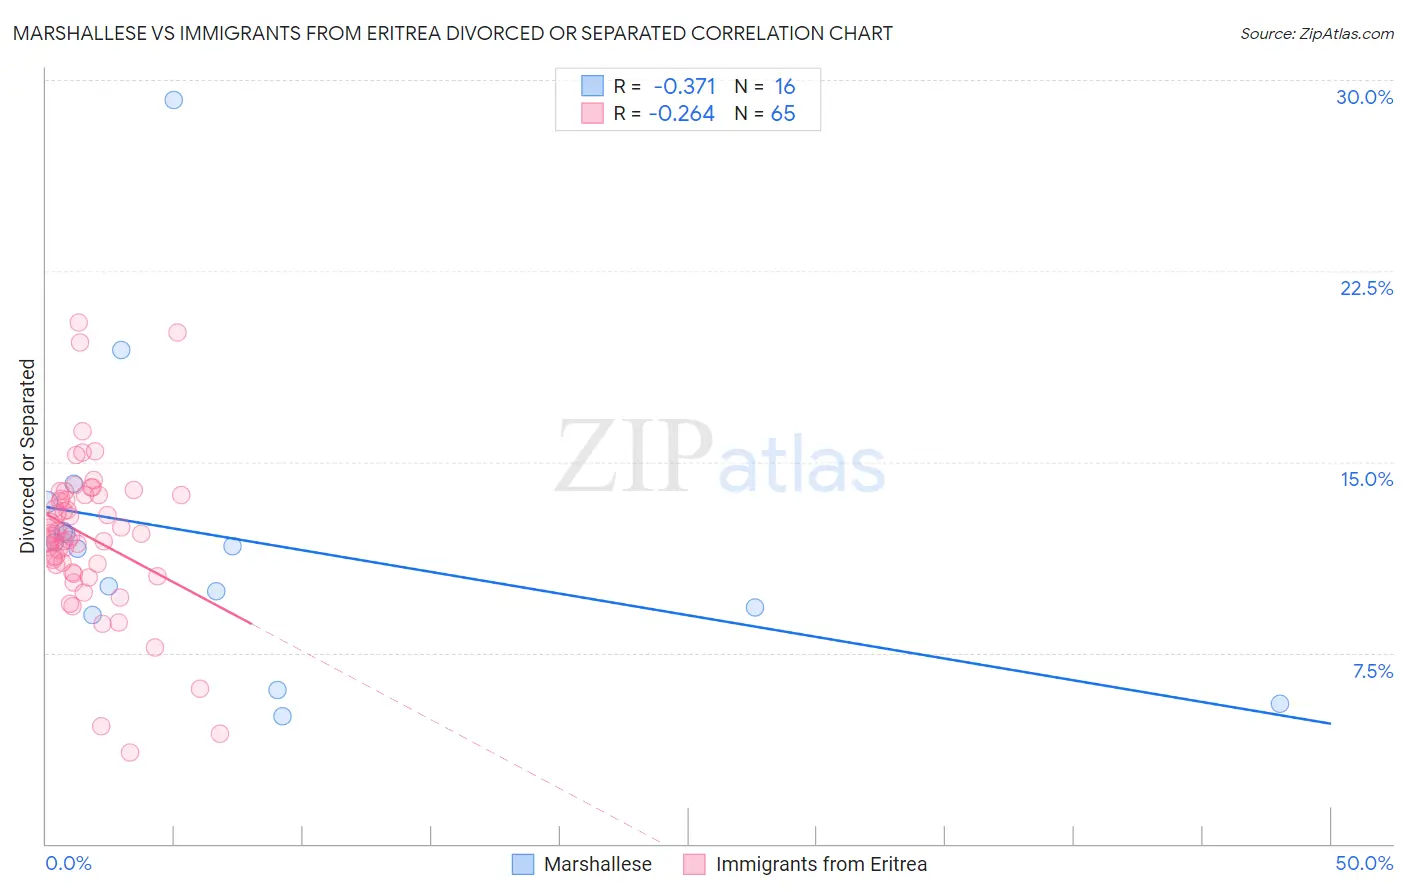
Marshallese vs Immigrants from Eritrea Divorced or Separated Correlation Chart
The statistical analysis conducted on geographies consisting of 14,761,315 people shows a mild negative correlation between the proportion of Marshallese and percentage of population currently divorced or separated in the United States with a correlation coefficient (R) of -0.371 and weighted average of 12.0%. Similarly, the statistical analysis conducted on geographies consisting of 104,847,630 people shows a weak negative correlation between the proportion of Immigrants from Eritrea and percentage of population currently divorced or separated in the United States with a correlation coefficient (R) of -0.264 and weighted average of 12.1%, a difference of 1.2%.
Divorced or Separated Correlation Summary
| Measurement | Marshallese | Immigrants from Eritrea |
| Minimum | 5.0% | 3.6% |
| Maximum | 29.2% | 20.5% |
| Range | 24.2% | 16.9% |
| Mean | 11.9% | 12.1% |
| Median | 11.7% | 12.2% |
| Interquartile 25% (IQ1) | 9.1% | 10.8% |
| Interquartile 75% (IQ3) | 12.8% | 13.7% |
| Interquartile Range (IQR) | 3.7% | 2.9% |
| Standard Deviation (Sample) | 5.8% | 3.1% |
| Standard Deviation (Population) | 5.6% | 3.0% |
Similar Demographics by Divorced or Separated
Demographics Similar to Marshallese by Divorced or Separated
In terms of divorced or separated, the demographic groups most similar to Marshallese are Samoan (12.0%, a difference of 0.010%), Navajo (12.0%, a difference of 0.030%), Immigrants from Scotland (12.0%, a difference of 0.040%), Swiss (12.0%, a difference of 0.040%), and Immigrants from Barbados (12.0%, a difference of 0.050%).
| Demographics | Rating | Rank | Divorced or Separated |
| Chileans | 71.3 /100 | #154 | Good 12.0% |
| Japanese | 70.9 /100 | #155 | Good 12.0% |
| Hungarians | 70.3 /100 | #156 | Good 12.0% |
| Immigrants | Brazil | 68.8 /100 | #157 | Good 12.0% |
| Icelanders | 66.0 /100 | #158 | Good 12.0% |
| Immigrants | Barbados | 66.0 /100 | #159 | Good 12.0% |
| Immigrants | Scotland | 65.8 /100 | #160 | Good 12.0% |
| Marshallese | 64.6 /100 | #161 | Good 12.0% |
| Samoans | 64.3 /100 | #162 | Good 12.0% |
| Navajo | 63.9 /100 | #163 | Good 12.0% |
| Swiss | 63.6 /100 | #164 | Good 12.0% |
| German Russians | 61.8 /100 | #165 | Good 12.0% |
| Tohono O'odham | 60.4 /100 | #166 | Good 12.0% |
| Ethiopians | 58.5 /100 | #167 | Average 12.0% |
| Serbians | 57.1 /100 | #168 | Average 12.0% |
Demographics Similar to Immigrants from Eritrea by Divorced or Separated
In terms of divorced or separated, the demographic groups most similar to Immigrants from Eritrea are Immigrants from Thailand (12.1%, a difference of 0.020%), Immigrants from England (12.1%, a difference of 0.020%), Norwegian (12.1%, a difference of 0.050%), Immigrants from Burma/Myanmar (12.1%, a difference of 0.060%), and Immigrants from Africa (12.1%, a difference of 0.060%).
| Demographics | Rating | Rank | Divorced or Separated |
| Belizeans | 37.7 /100 | #187 | Fair 12.1% |
| Immigrants | Belize | 37.6 /100 | #188 | Fair 12.1% |
| Sierra Leoneans | 35.5 /100 | #189 | Fair 12.1% |
| Moroccans | 34.8 /100 | #190 | Fair 12.1% |
| Swedes | 34.4 /100 | #191 | Fair 12.1% |
| Norwegians | 33.2 /100 | #192 | Fair 12.1% |
| Immigrants | Thailand | 32.5 /100 | #193 | Fair 12.1% |
| Immigrants | Eritrea | 31.9 /100 | #194 | Fair 12.1% |
| Immigrants | England | 31.4 /100 | #195 | Fair 12.1% |
| Immigrants | Burma/Myanmar | 30.4 /100 | #196 | Fair 12.1% |
| Immigrants | Africa | 30.3 /100 | #197 | Fair 12.1% |
| Nigerians | 30.1 /100 | #198 | Fair 12.1% |
| Central Americans | 29.4 /100 | #199 | Fair 12.1% |
| South Americans | 28.6 /100 | #200 | Fair 12.2% |
| Guatemalans | 26.9 /100 | #201 | Fair 12.2% |