Marshallese vs Danish Divorced or Separated
COMPARE
Marshallese
Danish
Divorced or Separated
Divorced or Separated Comparison
Marshallese
Danes
12.0%
DIVORCED OR SEPARATED
64.6/ 100
METRIC RATING
161st/ 347
METRIC RANK
11.9%
DIVORCED OR SEPARATED
84.8/ 100
METRIC RATING
135th/ 347
METRIC RANK
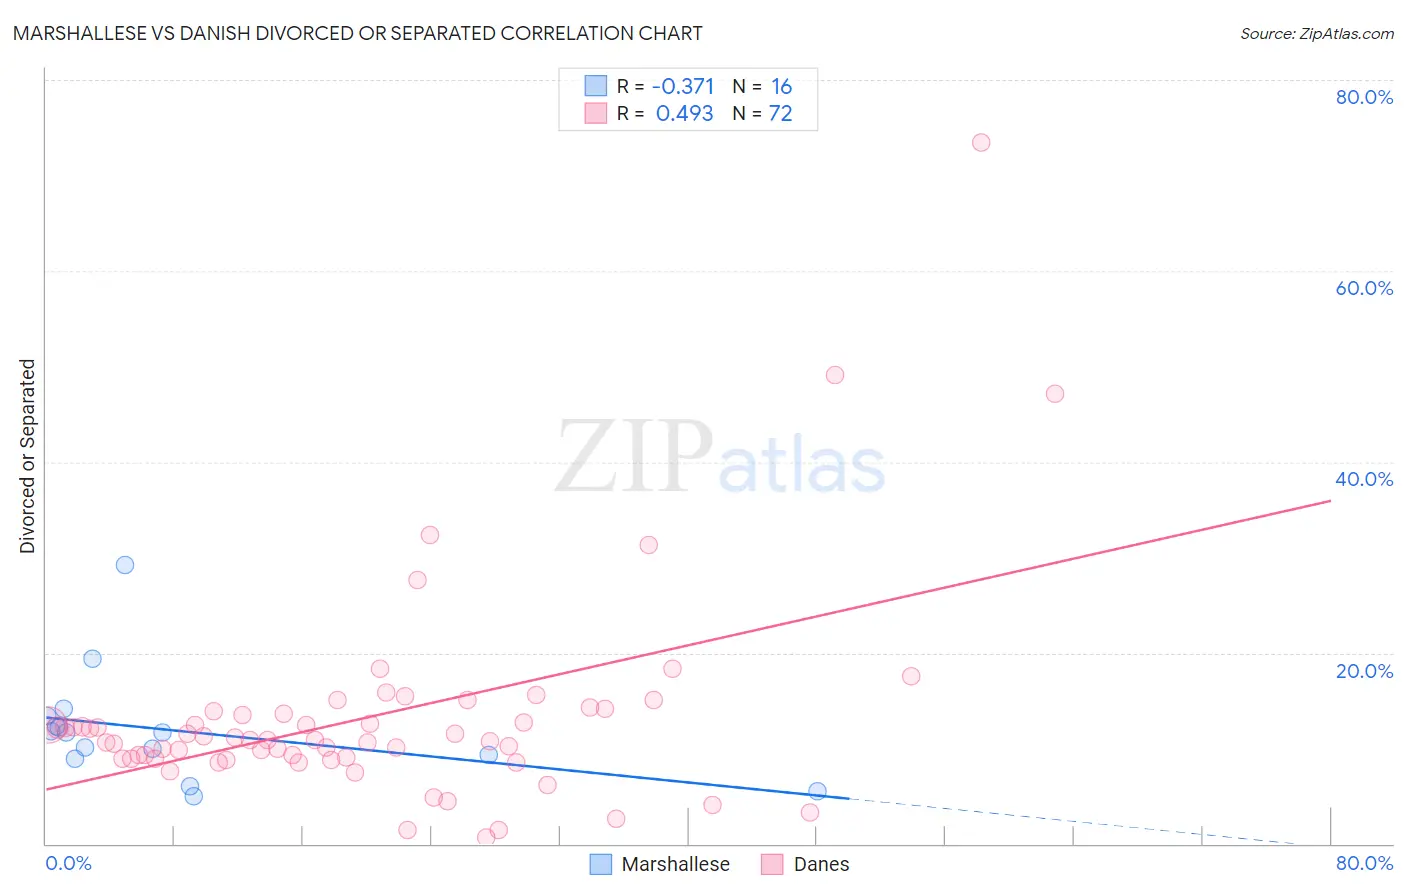
Marshallese vs Danish Divorced or Separated Correlation Chart
The statistical analysis conducted on geographies consisting of 14,761,315 people shows a mild negative correlation between the proportion of Marshallese and percentage of population currently divorced or separated in the United States with a correlation coefficient (R) of -0.371 and weighted average of 12.0%. Similarly, the statistical analysis conducted on geographies consisting of 473,966,187 people shows a moderate positive correlation between the proportion of Danes and percentage of population currently divorced or separated in the United States with a correlation coefficient (R) of 0.493 and weighted average of 11.9%, a difference of 0.99%.
Divorced or Separated Correlation Summary
| Measurement | Marshallese | Danish |
| Minimum | 5.0% | 0.70% |
| Maximum | 29.2% | 73.4% |
| Range | 24.2% | 72.7% |
| Mean | 11.9% | 13.2% |
| Median | 11.7% | 10.9% |
| Interquartile 25% (IQ1) | 9.1% | 8.9% |
| Interquartile 75% (IQ3) | 12.8% | 13.8% |
| Interquartile Range (IQR) | 3.7% | 4.8% |
| Standard Deviation (Sample) | 5.8% | 10.9% |
| Standard Deviation (Population) | 5.6% | 10.8% |
Similar Demographics by Divorced or Separated
Demographics Similar to Marshallese by Divorced or Separated
In terms of divorced or separated, the demographic groups most similar to Marshallese are Samoan (12.0%, a difference of 0.010%), Navajo (12.0%, a difference of 0.030%), Immigrants from Scotland (12.0%, a difference of 0.040%), Swiss (12.0%, a difference of 0.040%), and Immigrants from Barbados (12.0%, a difference of 0.050%).
| Demographics | Rating | Rank | Divorced or Separated |
| Chileans | 71.3 /100 | #154 | Good 12.0% |
| Japanese | 70.9 /100 | #155 | Good 12.0% |
| Hungarians | 70.3 /100 | #156 | Good 12.0% |
| Immigrants | Brazil | 68.8 /100 | #157 | Good 12.0% |
| Icelanders | 66.0 /100 | #158 | Good 12.0% |
| Immigrants | Barbados | 66.0 /100 | #159 | Good 12.0% |
| Immigrants | Scotland | 65.8 /100 | #160 | Good 12.0% |
| Marshallese | 64.6 /100 | #161 | Good 12.0% |
| Samoans | 64.3 /100 | #162 | Good 12.0% |
| Navajo | 63.9 /100 | #163 | Good 12.0% |
| Swiss | 63.6 /100 | #164 | Good 12.0% |
| German Russians | 61.8 /100 | #165 | Good 12.0% |
| Tohono O'odham | 60.4 /100 | #166 | Good 12.0% |
| Ethiopians | 58.5 /100 | #167 | Average 12.0% |
| Serbians | 57.1 /100 | #168 | Average 12.0% |
Demographics Similar to Danes by Divorced or Separated
In terms of divorced or separated, the demographic groups most similar to Danes are Carpatho Rusyn (11.9%, a difference of 0.0%), Argentinean (11.9%, a difference of 0.020%), Alsatian (11.9%, a difference of 0.060%), Immigrants from Netherlands (11.9%, a difference of 0.060%), and Australian (11.9%, a difference of 0.080%).
| Demographics | Rating | Rank | Divorced or Separated |
| Immigrants | Ecuador | 88.9 /100 | #128 | Excellent 11.8% |
| Immigrants | St. Vincent and the Grenadines | 88.4 /100 | #129 | Excellent 11.8% |
| Immigrants | Austria | 88.2 /100 | #130 | Excellent 11.8% |
| Immigrants | Cambodia | 88.2 /100 | #131 | Excellent 11.8% |
| Immigrants | Afghanistan | 87.9 /100 | #132 | Excellent 11.8% |
| New Zealanders | 87.5 /100 | #133 | Excellent 11.9% |
| Argentineans | 85.1 /100 | #134 | Excellent 11.9% |
| Danes | 84.8 /100 | #135 | Excellent 11.9% |
| Carpatho Rusyns | 84.8 /100 | #136 | Excellent 11.9% |
| Alsatians | 84.0 /100 | #137 | Excellent 11.9% |
| Immigrants | Netherlands | 83.9 /100 | #138 | Excellent 11.9% |
| Australians | 83.6 /100 | #139 | Excellent 11.9% |
| Lebanese | 83.4 /100 | #140 | Excellent 11.9% |
| Immigrants | Morocco | 82.9 /100 | #141 | Excellent 11.9% |
| Immigrants | Zimbabwe | 81.5 /100 | #142 | Excellent 11.9% |