Cuban vs Indonesian Family Households
COMPARE
Cuban
Indonesian
Family Households
Family Households Comparison
Cubans
Indonesians
67.7%
FAMILY HOUSEHOLDS
100.0/ 100
METRIC RATING
21st/ 347
METRIC RANK
61.5%
FAMILY HOUSEHOLDS
0.0/ 100
METRIC RATING
326th/ 347
METRIC RANK
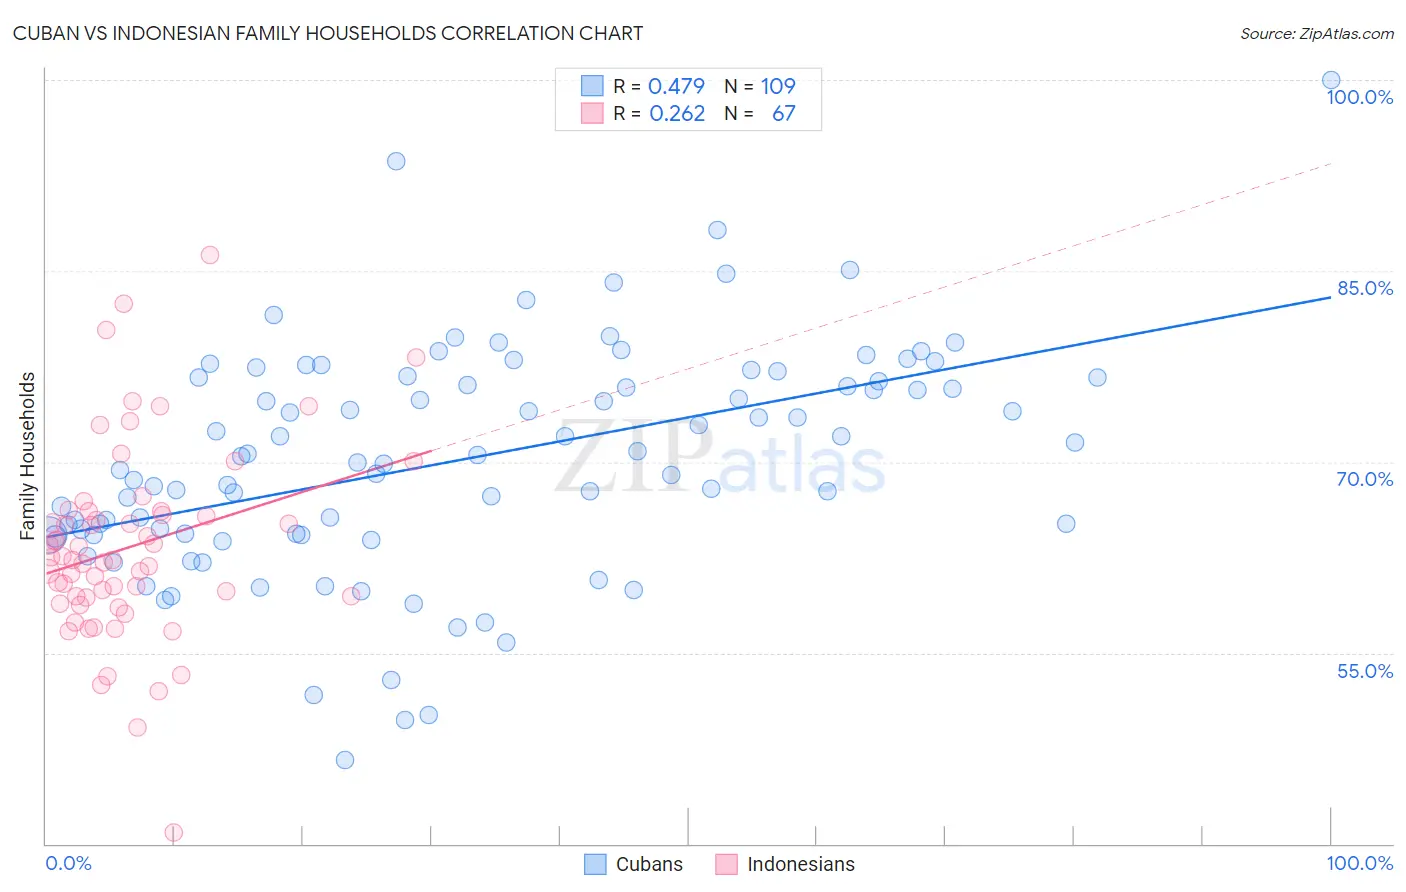
Cuban vs Indonesian Family Households Correlation Chart
The statistical analysis conducted on geographies consisting of 448,974,040 people shows a moderate positive correlation between the proportion of Cubans and percentage of family households in the United States with a correlation coefficient (R) of 0.479 and weighted average of 67.7%. Similarly, the statistical analysis conducted on geographies consisting of 162,647,758 people shows a weak positive correlation between the proportion of Indonesians and percentage of family households in the United States with a correlation coefficient (R) of 0.262 and weighted average of 61.5%, a difference of 10.2%.
Family Households Correlation Summary
| Measurement | Cuban | Indonesian |
| Minimum | 46.6% | 40.9% |
| Maximum | 100.0% | 86.2% |
| Range | 53.4% | 45.3% |
| Mean | 70.2% | 63.3% |
| Median | 70.5% | 62.3% |
| Interquartile 25% (IQ1) | 64.3% | 59.4% |
| Interquartile 75% (IQ3) | 76.6% | 66.1% |
| Interquartile Range (IQR) | 12.3% | 6.7% |
| Standard Deviation (Sample) | 9.0% | 7.6% |
| Standard Deviation (Population) | 9.0% | 7.6% |
Similar Demographics by Family Households
Demographics Similar to Cubans by Family Households
In terms of family households, the demographic groups most similar to Cubans are Sri Lankan (67.7%, a difference of 0.040%), Inupiat (67.8%, a difference of 0.050%), Immigrants from Pakistan (67.7%, a difference of 0.12%), Samoan (67.9%, a difference of 0.30%), and Immigrants from South Eastern Asia (67.5%, a difference of 0.41%).
| Demographics | Rating | Rank | Family Households |
| Immigrants | Cuba | 100.0 /100 | #14 | Exceptional 68.2% |
| Assyrians/Chaldeans/Syriacs | 100.0 /100 | #15 | Exceptional 68.2% |
| Immigrants | Vietnam | 100.0 /100 | #16 | Exceptional 68.2% |
| Chinese | 100.0 /100 | #17 | Exceptional 68.1% |
| Immigrants | Taiwan | 100.0 /100 | #18 | Exceptional 68.0% |
| Samoans | 100.0 /100 | #19 | Exceptional 67.9% |
| Inupiat | 100.0 /100 | #20 | Exceptional 67.8% |
| Cubans | 100.0 /100 | #21 | Exceptional 67.7% |
| Sri Lankans | 100.0 /100 | #22 | Exceptional 67.7% |
| Immigrants | Pakistan | 100.0 /100 | #23 | Exceptional 67.7% |
| Immigrants | South Eastern Asia | 100.0 /100 | #24 | Exceptional 67.5% |
| Immigrants | Nicaragua | 100.0 /100 | #25 | Exceptional 67.5% |
| Immigrants | India | 100.0 /100 | #26 | Exceptional 67.4% |
| Hispanics or Latinos | 100.0 /100 | #27 | Exceptional 67.4% |
| Hawaiians | 100.0 /100 | #28 | Exceptional 67.4% |
Demographics Similar to Indonesians by Family Households
In terms of family households, the demographic groups most similar to Indonesians are Black/African American (61.5%, a difference of 0.020%), Kiowa (61.4%, a difference of 0.15%), Cambodian (61.4%, a difference of 0.18%), Immigrants from Switzerland (61.6%, a difference of 0.19%), and Immigrants from West Indies (61.6%, a difference of 0.20%).
| Demographics | Rating | Rank | Family Households |
| Cape Verdeans | 0.0 /100 | #319 | Tragic 61.8% |
| Ugandans | 0.0 /100 | #320 | Tragic 61.7% |
| Alsatians | 0.0 /100 | #321 | Tragic 61.7% |
| Immigrants | Serbia | 0.0 /100 | #322 | Tragic 61.6% |
| Tlingit-Haida | 0.0 /100 | #323 | Tragic 61.6% |
| Immigrants | West Indies | 0.0 /100 | #324 | Tragic 61.6% |
| Immigrants | Switzerland | 0.0 /100 | #325 | Tragic 61.6% |
| Indonesians | 0.0 /100 | #326 | Tragic 61.5% |
| Blacks/African Americans | 0.0 /100 | #327 | Tragic 61.5% |
| Kiowa | 0.0 /100 | #328 | Tragic 61.4% |
| Cambodians | 0.0 /100 | #329 | Tragic 61.4% |
| Immigrants | Australia | 0.0 /100 | #330 | Tragic 61.3% |
| Immigrants | France | 0.0 /100 | #331 | Tragic 61.3% |
| Ethiopians | 0.0 /100 | #332 | Tragic 61.2% |
| Immigrants | Ethiopia | 0.0 /100 | #333 | Tragic 61.2% |