Immigrants from Iran vs Indonesian Family Households
COMPARE
Immigrants from Iran
Indonesian
Family Households
Family Households Comparison
Immigrants from Iran
Indonesians
64.1%
FAMILY HOUSEHOLDS
30.4/ 100
METRIC RATING
185th/ 347
METRIC RANK
61.5%
FAMILY HOUSEHOLDS
0.0/ 100
METRIC RATING
326th/ 347
METRIC RANK
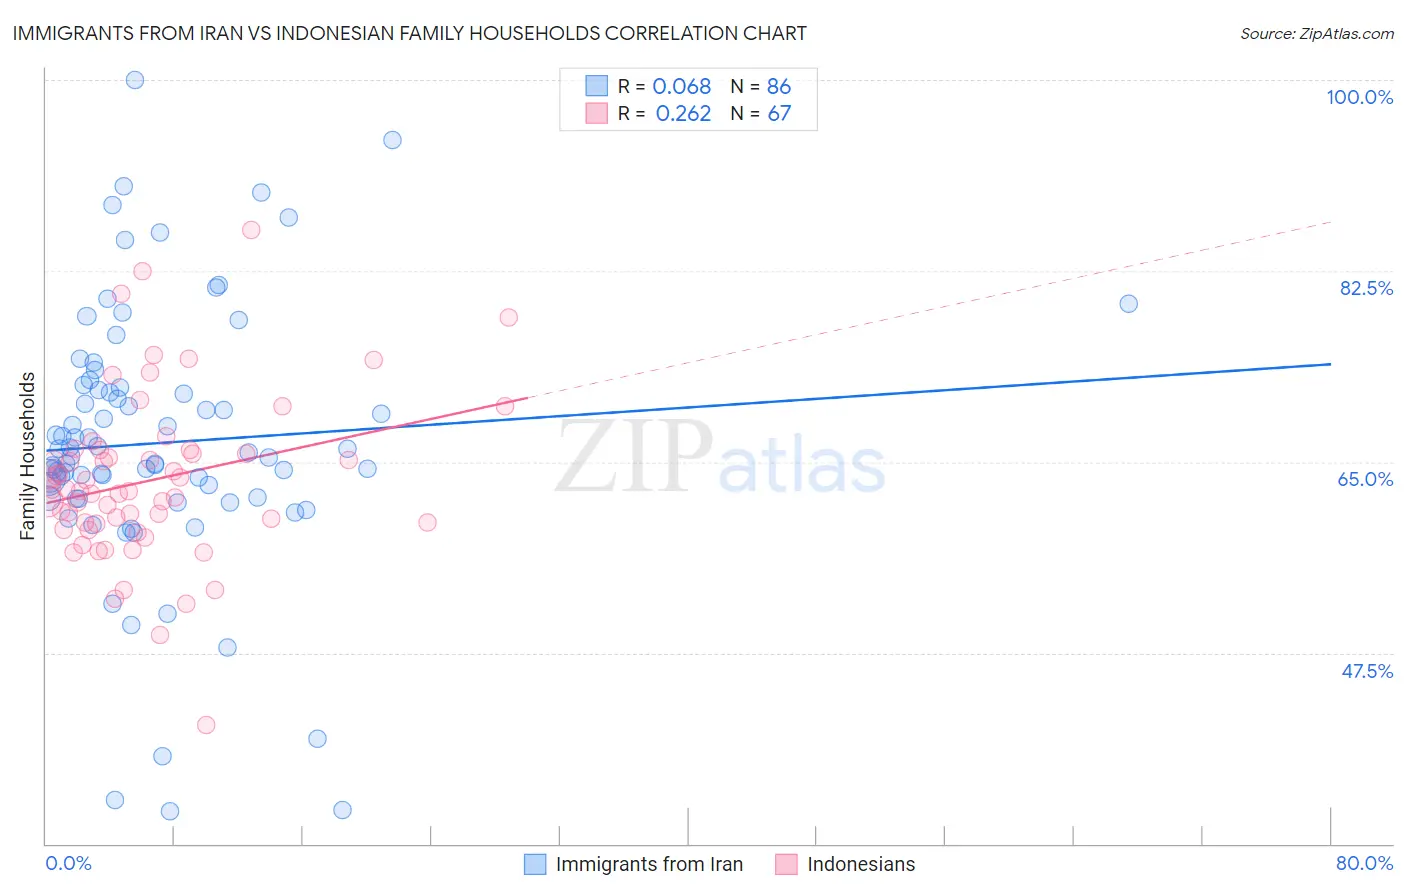
Immigrants from Iran vs Indonesian Family Households Correlation Chart
The statistical analysis conducted on geographies consisting of 279,831,456 people shows a slight positive correlation between the proportion of Immigrants from Iran and percentage of family households in the United States with a correlation coefficient (R) of 0.068 and weighted average of 64.1%. Similarly, the statistical analysis conducted on geographies consisting of 162,647,758 people shows a weak positive correlation between the proportion of Indonesians and percentage of family households in the United States with a correlation coefficient (R) of 0.262 and weighted average of 61.5%, a difference of 4.3%.
Family Households Correlation Summary
| Measurement | Immigrants from Iran | Indonesian |
| Minimum | 33.0% | 40.9% |
| Maximum | 100.0% | 86.2% |
| Range | 67.0% | 45.3% |
| Mean | 66.7% | 63.3% |
| Median | 65.7% | 62.3% |
| Interquartile 25% (IQ1) | 61.7% | 59.4% |
| Interquartile 75% (IQ3) | 71.8% | 66.1% |
| Interquartile Range (IQR) | 10.2% | 6.7% |
| Standard Deviation (Sample) | 12.3% | 7.6% |
| Standard Deviation (Population) | 12.3% | 7.6% |
Similar Demographics by Family Households
Demographics Similar to Immigrants from Iran by Family Households
In terms of family households, the demographic groups most similar to Immigrants from Iran are Spanish American (64.1%, a difference of 0.010%), Northern European (64.1%, a difference of 0.040%), Puerto Rican (64.2%, a difference of 0.050%), Ukrainian (64.2%, a difference of 0.060%), and Creek (64.2%, a difference of 0.060%).
| Demographics | Rating | Rank | Family Households |
| Jamaicans | 40.6 /100 | #178 | Average 64.2% |
| Immigrants | Ukraine | 38.2 /100 | #179 | Fair 64.2% |
| Immigrants | Honduras | 35.0 /100 | #180 | Fair 64.2% |
| Immigrants | Trinidad and Tobago | 34.9 /100 | #181 | Fair 64.2% |
| Ukrainians | 34.6 /100 | #182 | Fair 64.2% |
| Creek | 34.1 /100 | #183 | Fair 64.2% |
| Puerto Ricans | 33.4 /100 | #184 | Fair 64.2% |
| Immigrants | Iran | 30.4 /100 | #185 | Fair 64.1% |
| Spanish Americans | 30.1 /100 | #186 | Fair 64.1% |
| Northern Europeans | 28.2 /100 | #187 | Fair 64.1% |
| Paraguayans | 26.7 /100 | #188 | Fair 64.1% |
| Immigrants | Western Asia | 25.3 /100 | #189 | Fair 64.1% |
| Zimbabweans | 24.7 /100 | #190 | Fair 64.1% |
| Arabs | 24.5 /100 | #191 | Fair 64.1% |
| Lithuanians | 23.8 /100 | #192 | Fair 64.0% |
Demographics Similar to Indonesians by Family Households
In terms of family households, the demographic groups most similar to Indonesians are Black/African American (61.5%, a difference of 0.020%), Kiowa (61.4%, a difference of 0.15%), Cambodian (61.4%, a difference of 0.18%), Immigrants from Switzerland (61.6%, a difference of 0.19%), and Immigrants from West Indies (61.6%, a difference of 0.20%).
| Demographics | Rating | Rank | Family Households |
| Cape Verdeans | 0.0 /100 | #319 | Tragic 61.8% |
| Ugandans | 0.0 /100 | #320 | Tragic 61.7% |
| Alsatians | 0.0 /100 | #321 | Tragic 61.7% |
| Immigrants | Serbia | 0.0 /100 | #322 | Tragic 61.6% |
| Tlingit-Haida | 0.0 /100 | #323 | Tragic 61.6% |
| Immigrants | West Indies | 0.0 /100 | #324 | Tragic 61.6% |
| Immigrants | Switzerland | 0.0 /100 | #325 | Tragic 61.6% |
| Indonesians | 0.0 /100 | #326 | Tragic 61.5% |
| Blacks/African Americans | 0.0 /100 | #327 | Tragic 61.5% |
| Kiowa | 0.0 /100 | #328 | Tragic 61.4% |
| Cambodians | 0.0 /100 | #329 | Tragic 61.4% |
| Immigrants | Australia | 0.0 /100 | #330 | Tragic 61.3% |
| Immigrants | France | 0.0 /100 | #331 | Tragic 61.3% |
| Ethiopians | 0.0 /100 | #332 | Tragic 61.2% |
| Immigrants | Ethiopia | 0.0 /100 | #333 | Tragic 61.2% |